Crypto Price Analysis & Overview September 18th: Bitcoin, Ethereum, Ripple, Binance Coin, and Polkadot
Bitcoin
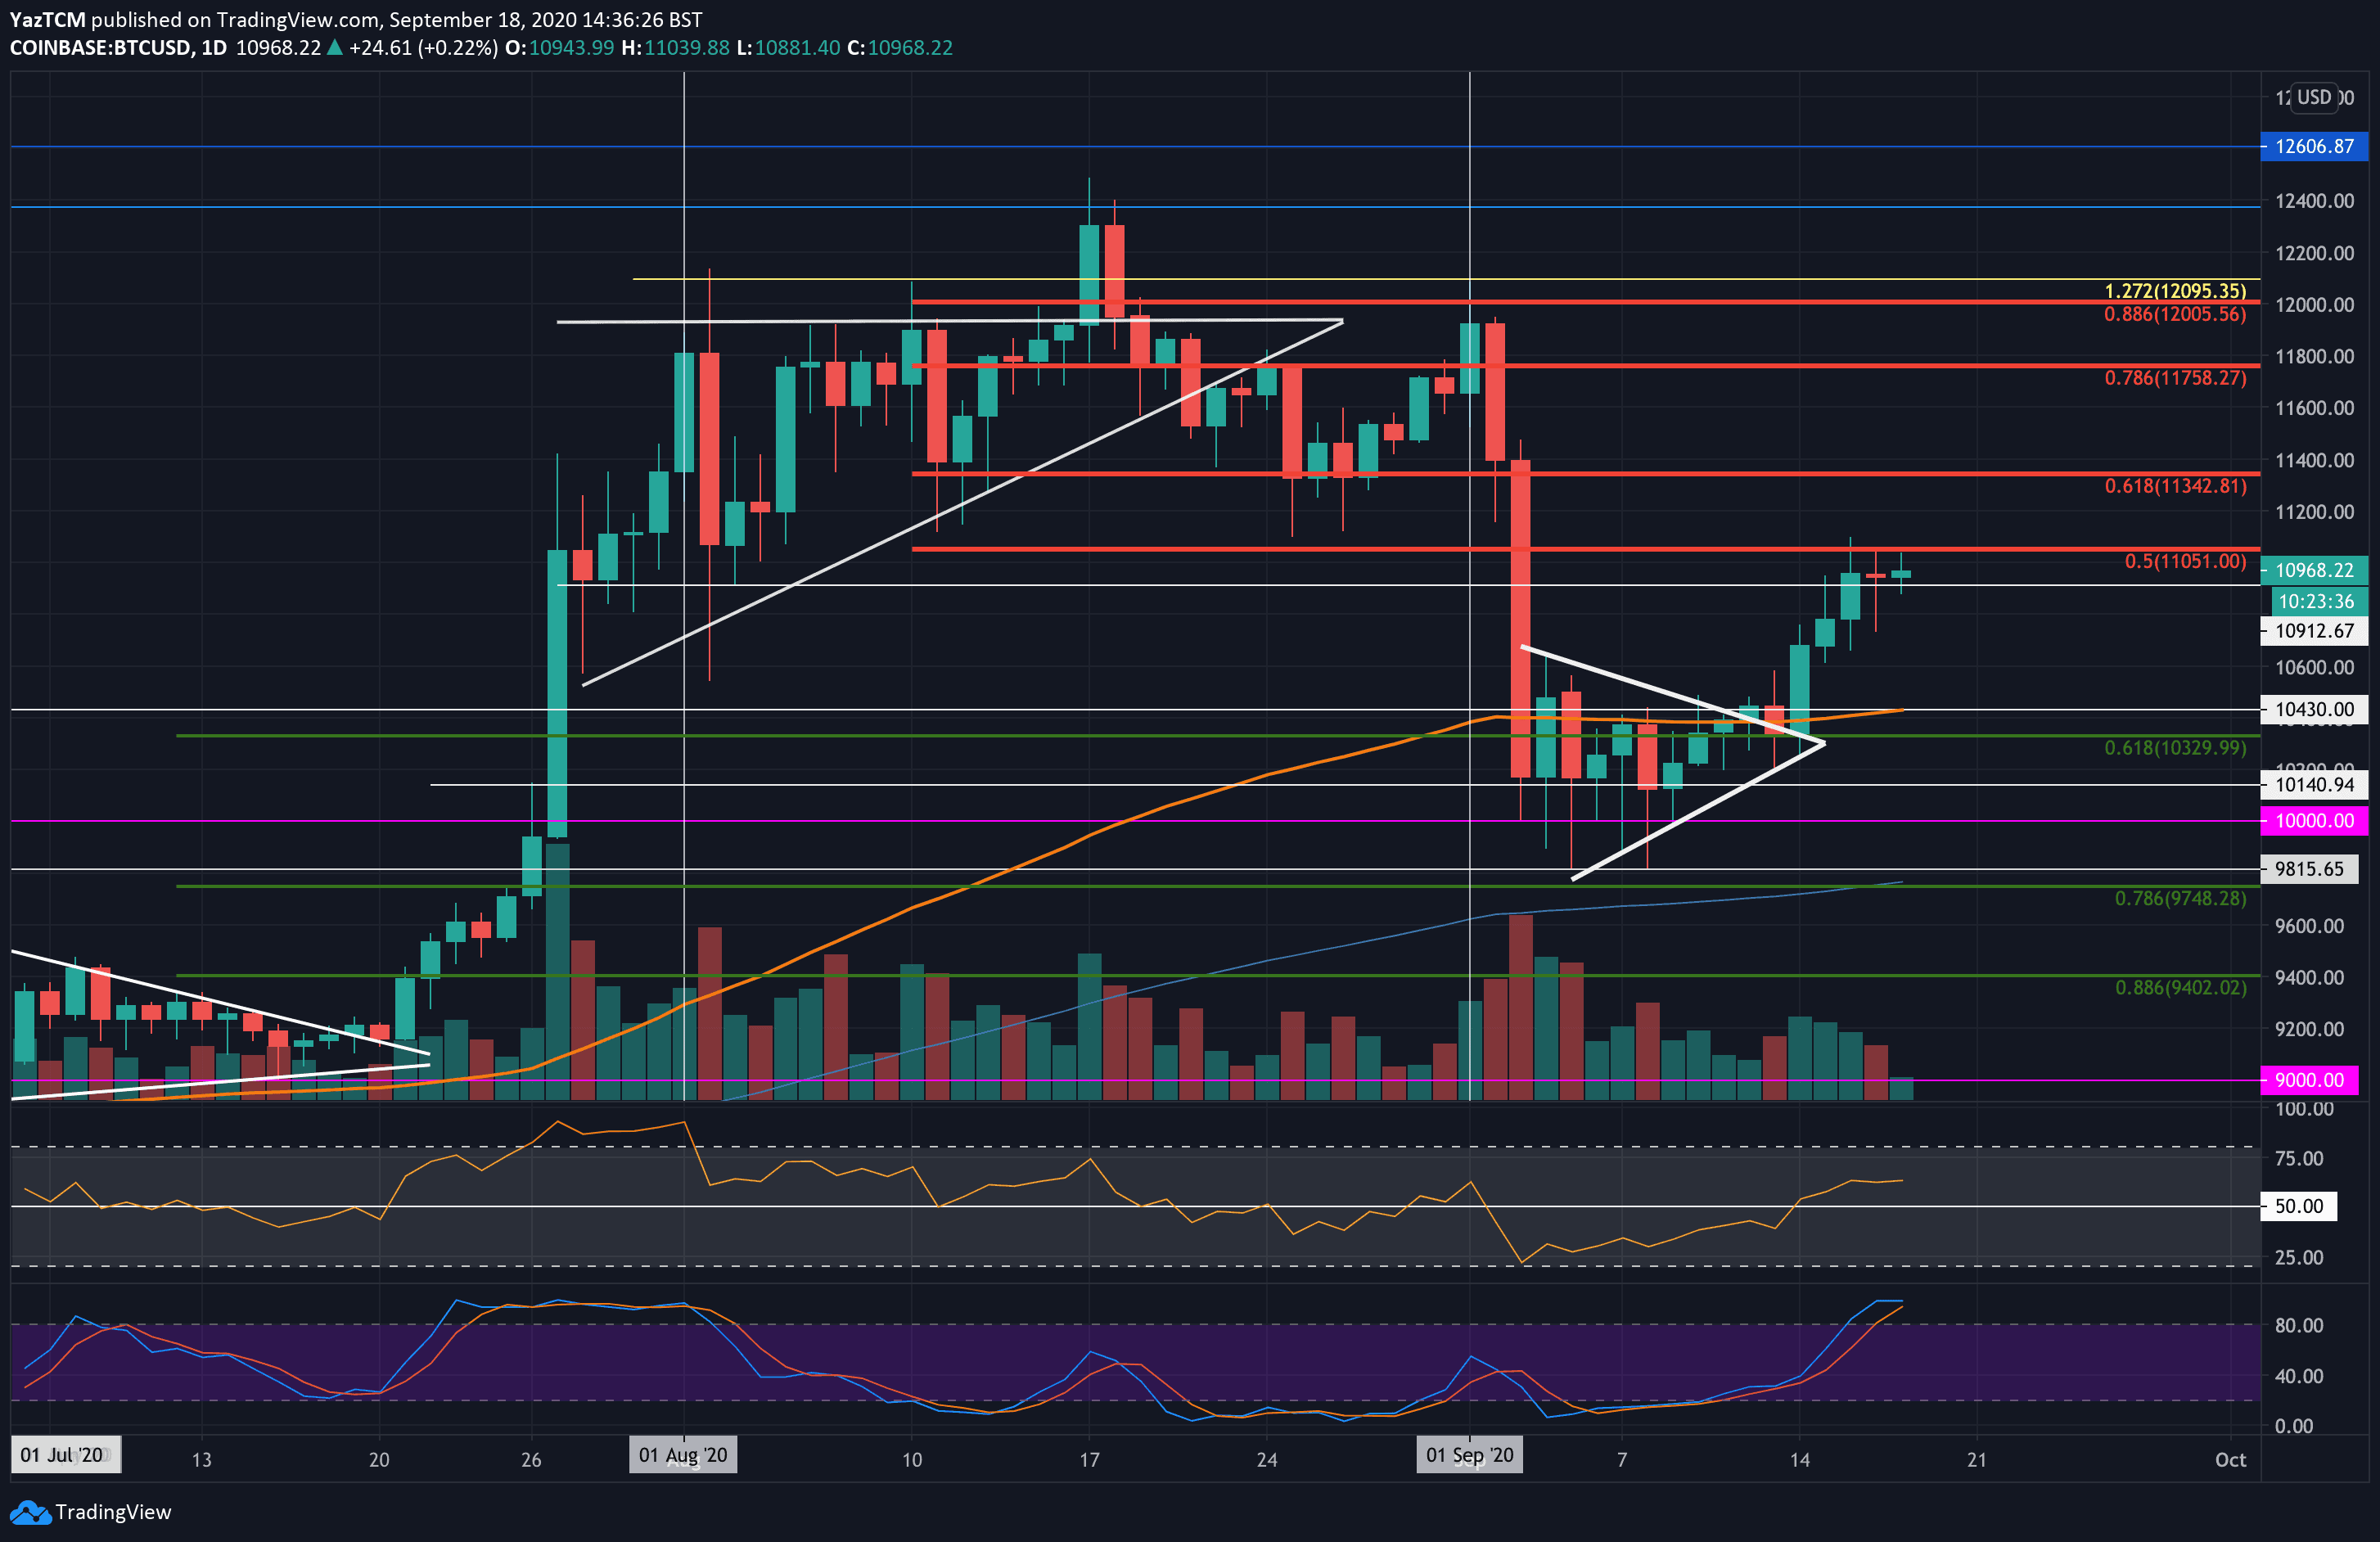
Bitcoin saw a positive 6% price increase this week as it edges its way toward the $11,000 level. The cryptocurrency was trading within a symmetrical triangle pattern last week after consolidating prior for 10-days. This symmetrical triangle broke over the weekend – providing the first signal that BTC was about to push higher.
After breaking above, Bitcoin continued to push beyond resistance at $10,600 as it reached resistance at $11,051 (bearish .5 Fib Retracement) yesterday. The bullish push has stalled at this resistance and will need to push beyond here to continue this rebound.
Looking ahead, if the bulls break $11,000 and $11,051, resistance lies at $11,200, $11,340 (bearish .618 Fib Retracenement), $11,500, and $11,760 (bearish .786 Fib Retracement). The last level of resistance lies at $12,000 (bearish .886 Fib Retracement).
On the other side, the first level of support lies at $10,900. This is followed by support at $10,500, $10,430 (100-days EMA), $10,330, $10,140, and $10,000.
Ethereum
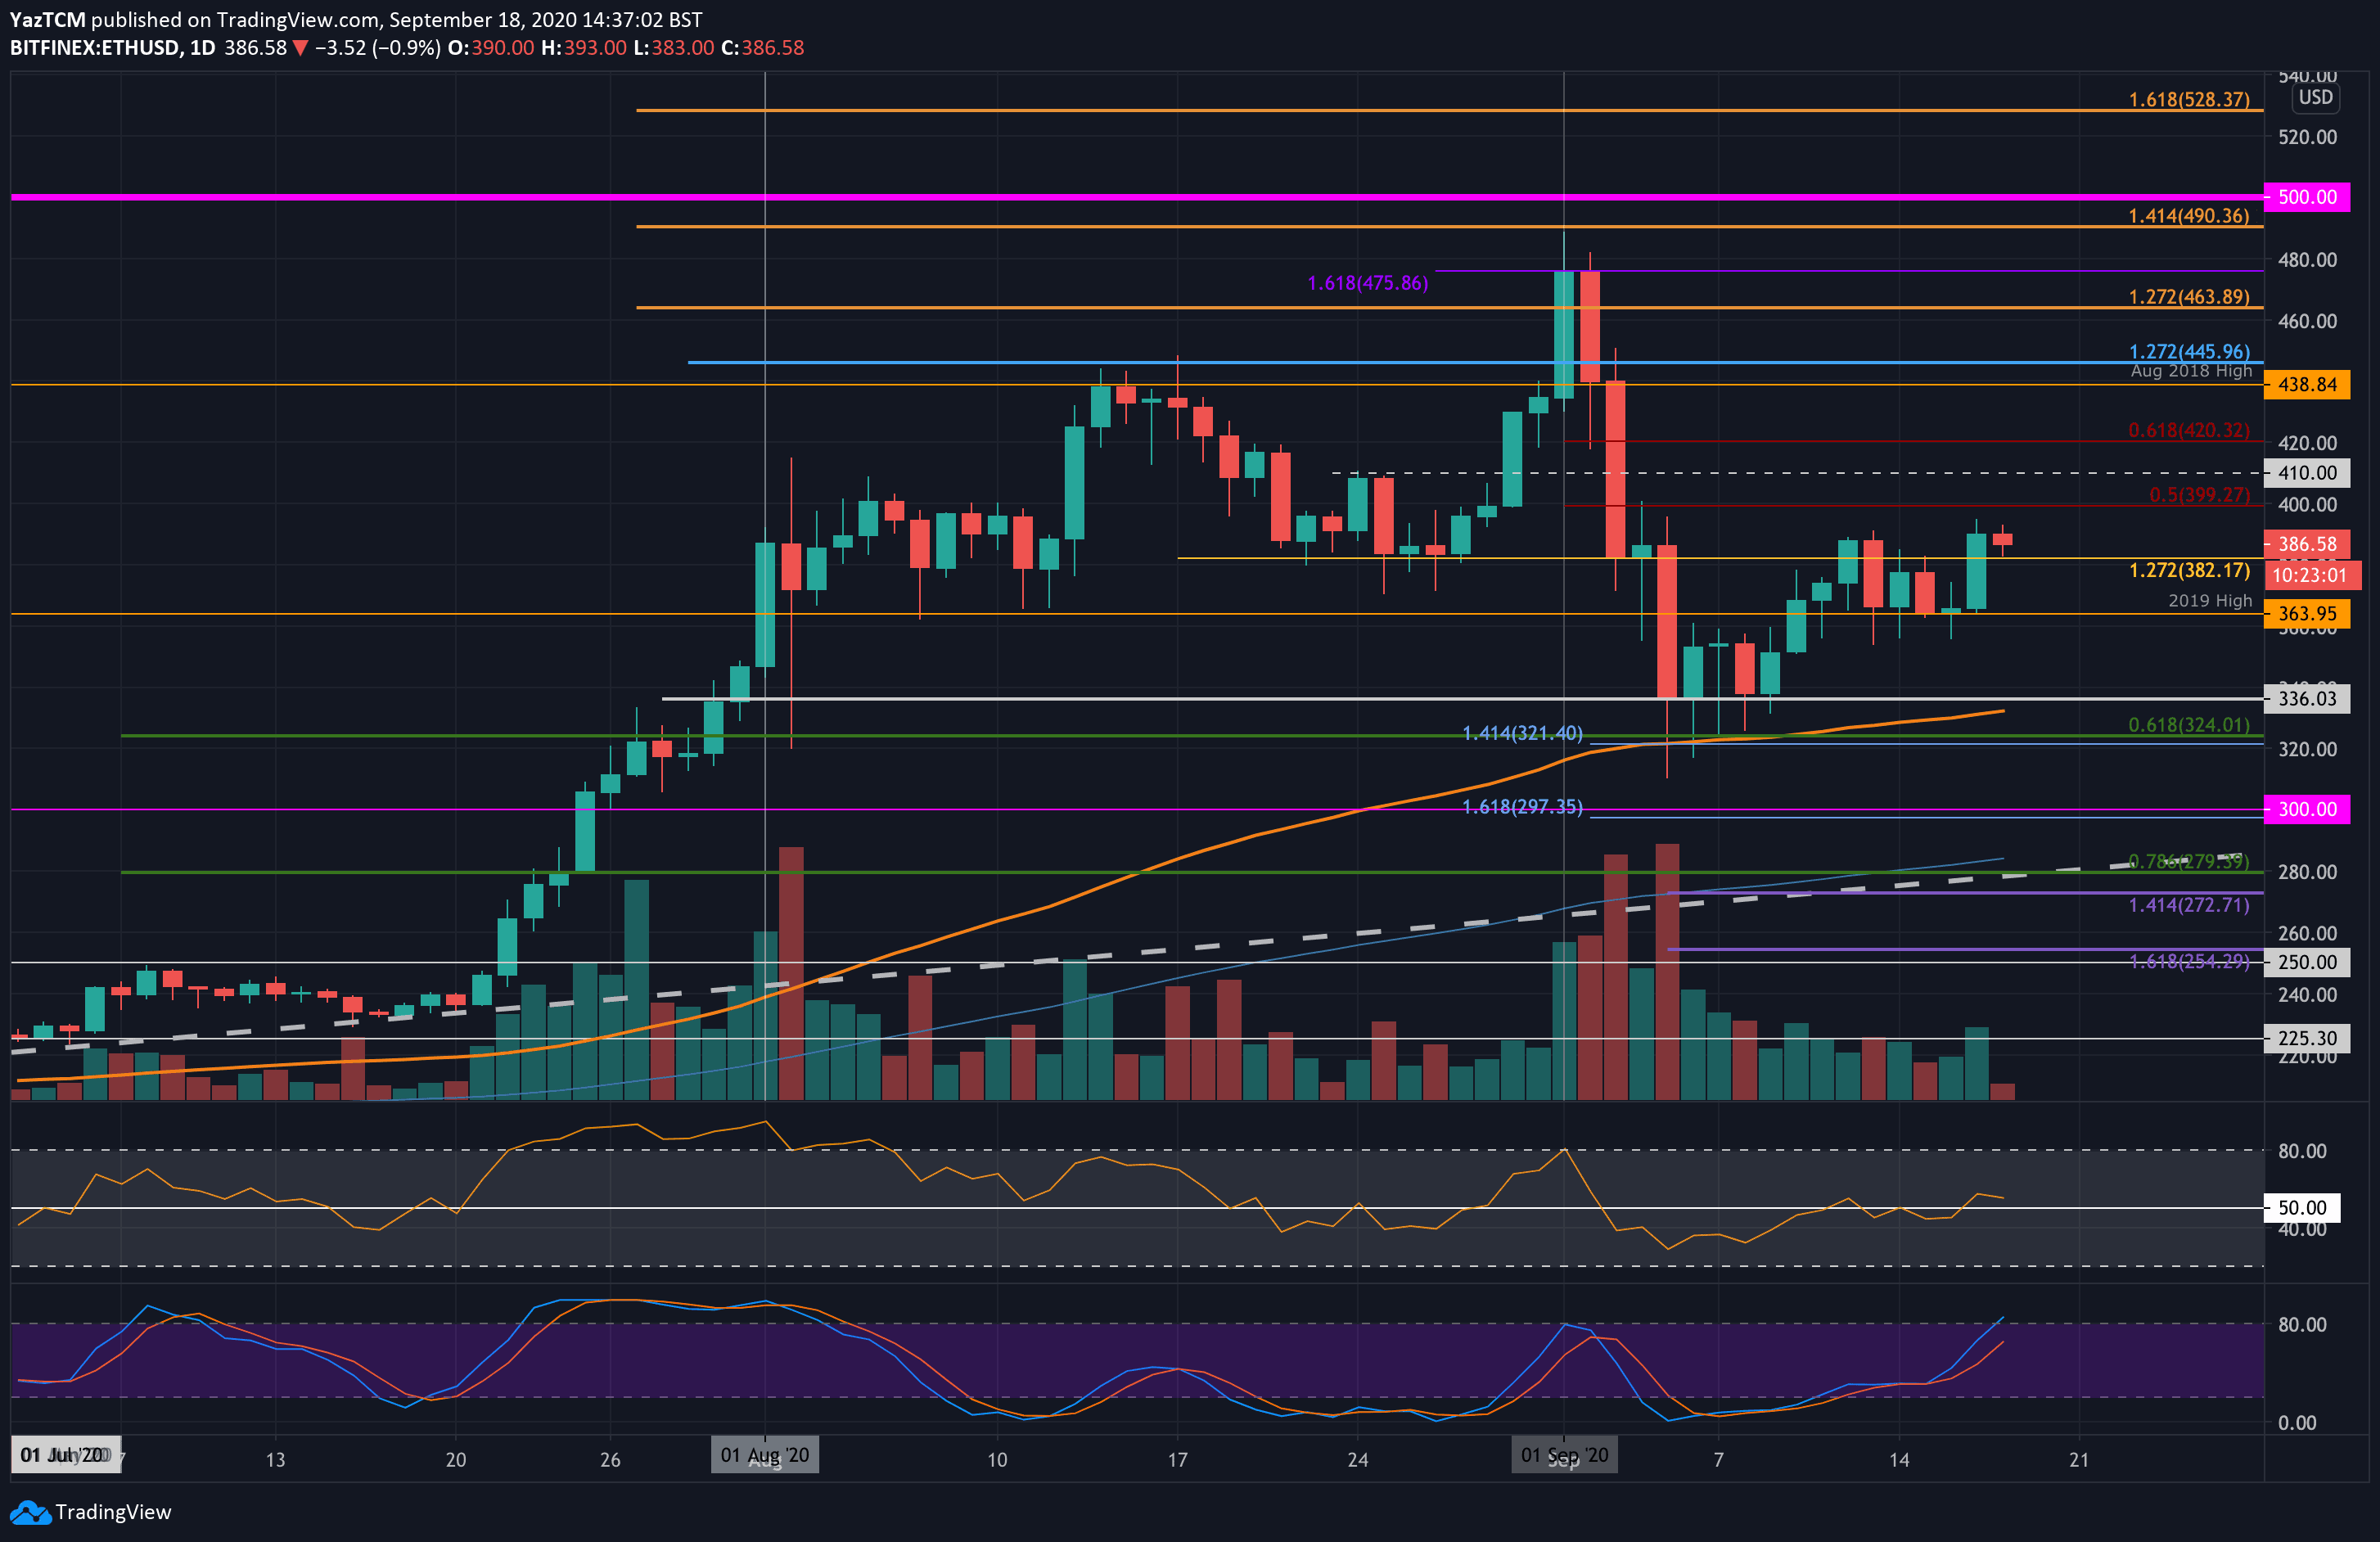
Ethereum also saw a healthy 4.5% price increase this week as it hits the $385 level. Ethereum was trading at around $385 on Saturday as it headed lower during the weekend. It managed to find support at $364 (2019 high) and held at this level over the following 4-days.
Yesterday, Ethereum bounced higher from the $364 support and reached as high as $490. It has been unable to break this resistance as it trades at $386 right now.
Looking ahead, if the buyers can break $390, resistance lies at $400, $410, and $420 (bearish .618 Fib Retracement). Above this, resistance lies at $438 (August 2018 High), $450, and $465.
On the other side, the first level of support lies at $382. This is followed by support at $364 (2019 high), $350, and $336.
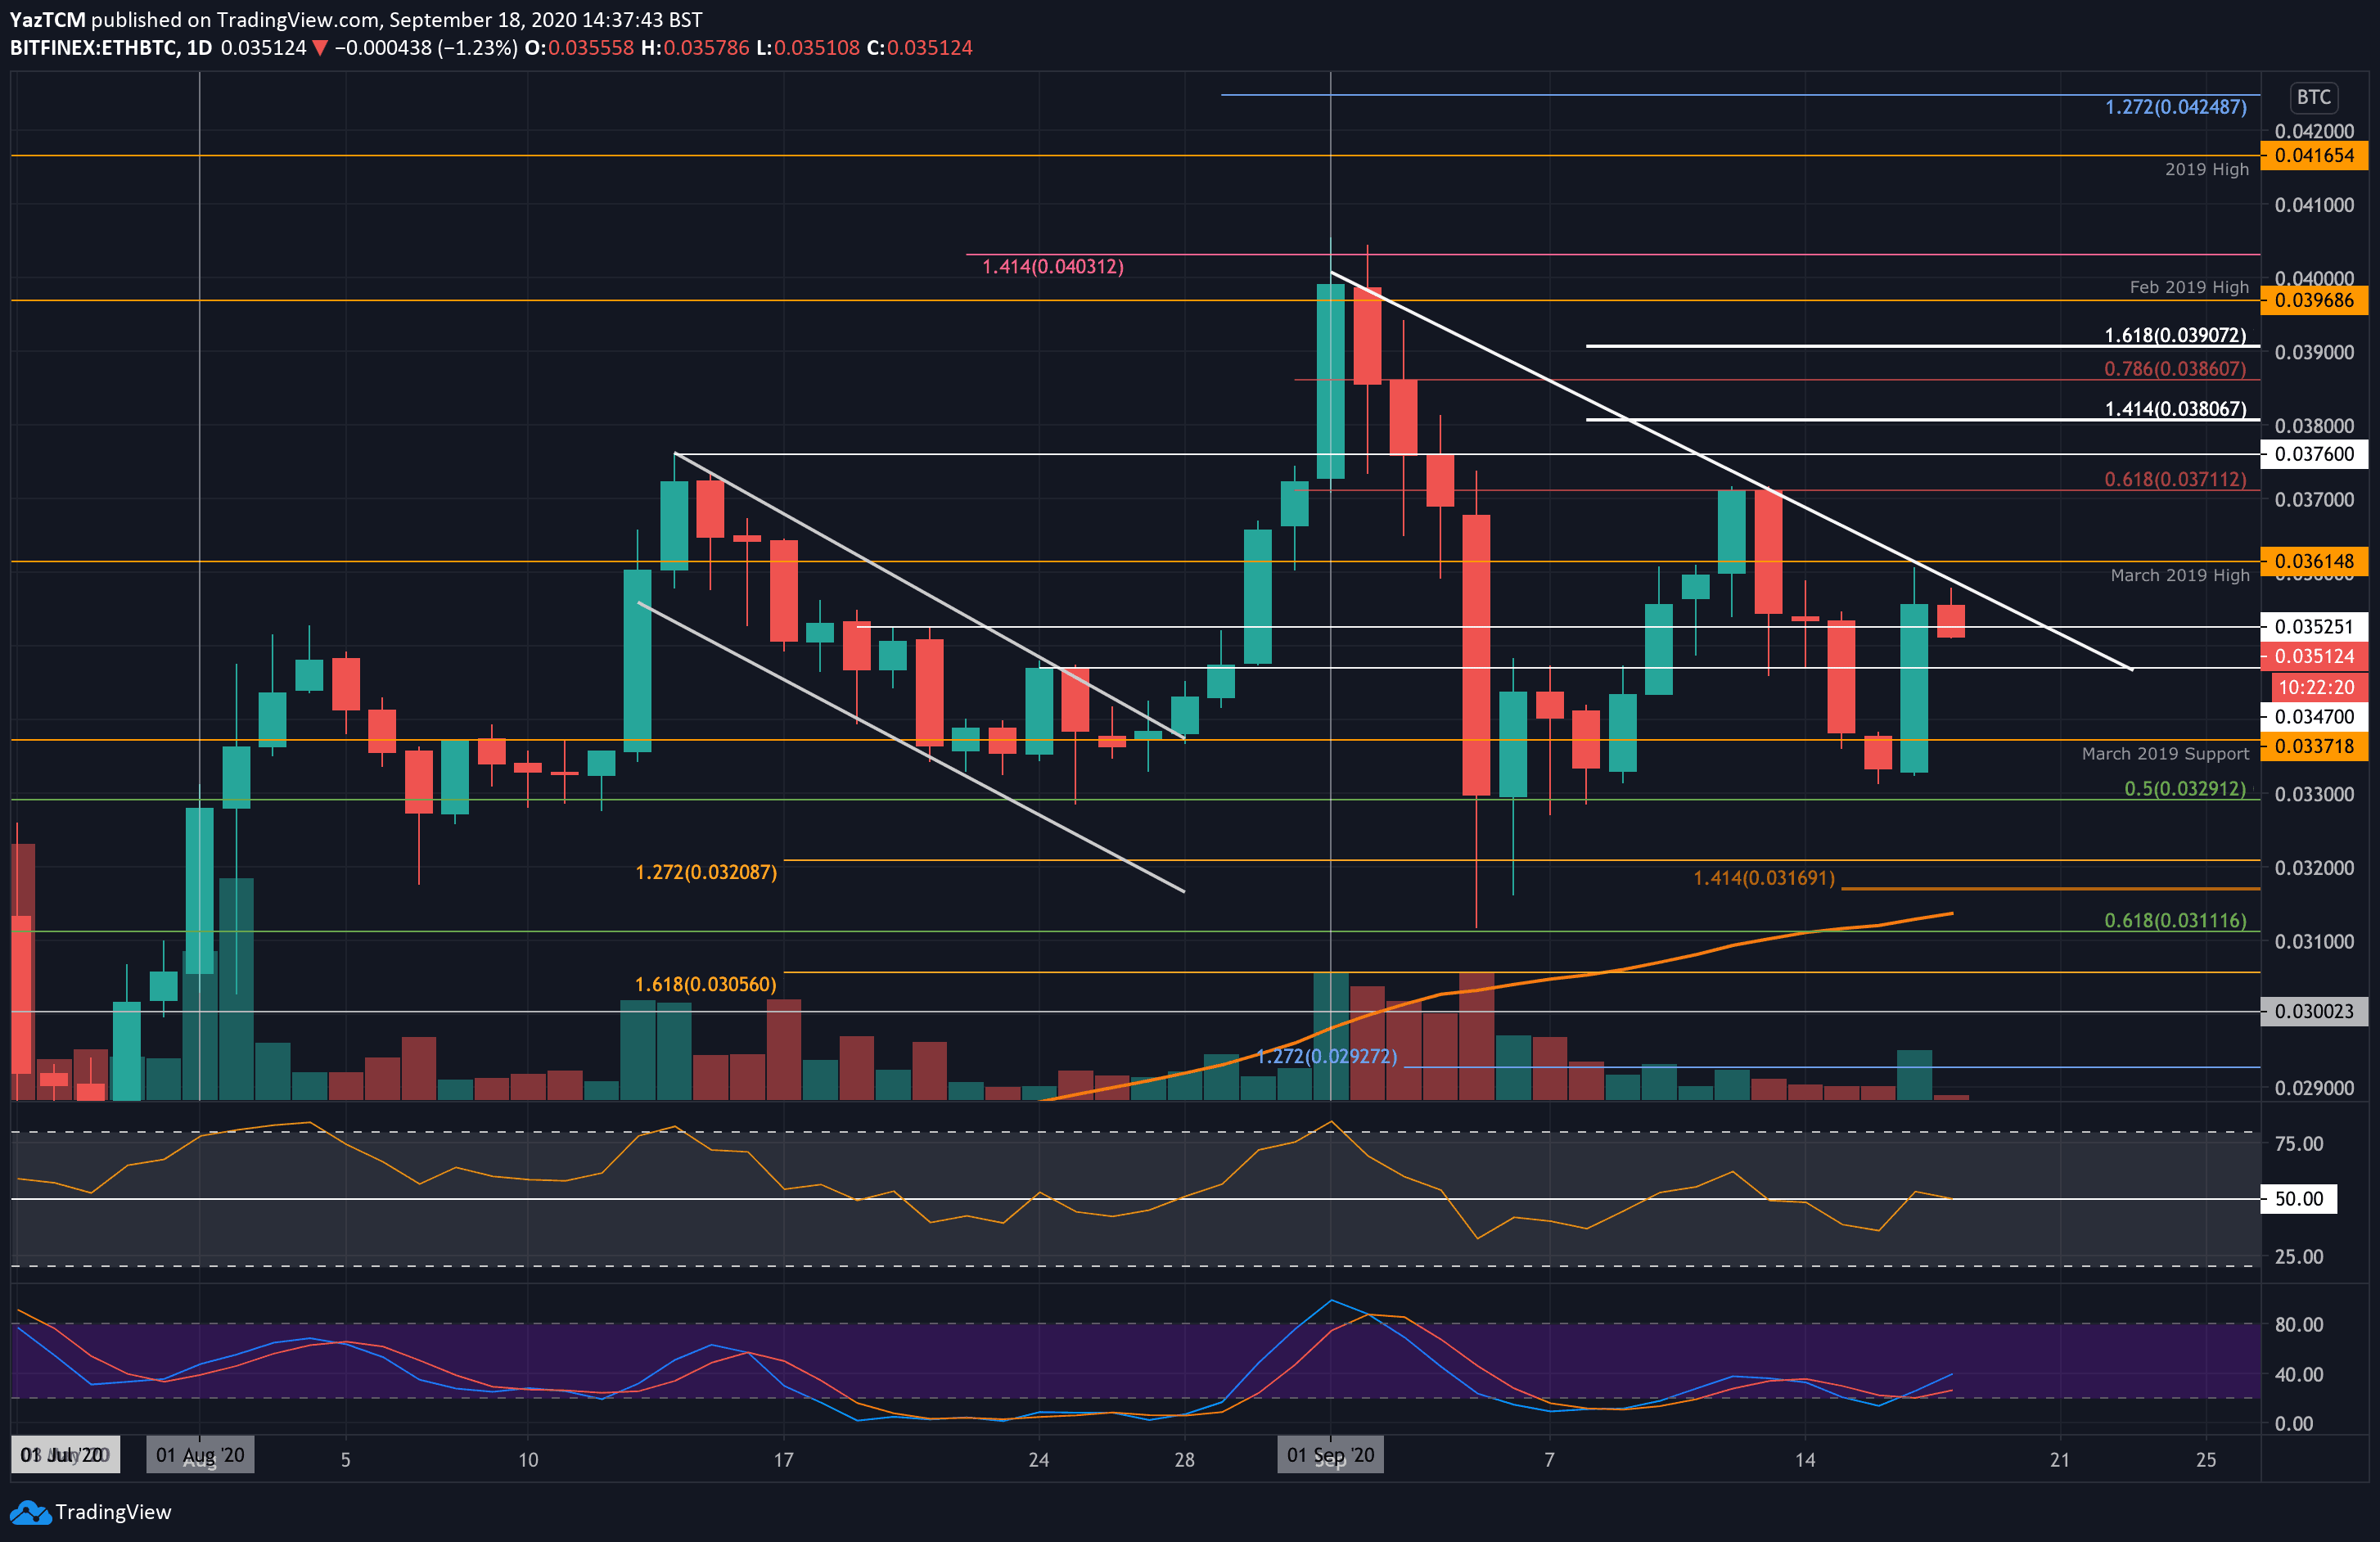
Ethereum has suffered against Bitcoin this week. The coin was trading at 0.0371 BTC last Friday as it hit resistance at a bearish .618 Fib Retracement level. It was unable to break this resistance as it rolled over throughout the week.
The selling continued until ETH hit 0.0332 BTC yesterday, which allowed it to rebound higher. The rebound ran into resistance at 0.0361 BTC (March 2019 High) and was unable to break above this. A falling trend line further bolstered the resistance here.
Looking ahead, the first level of resistance to break lies at the falling trend line. This is followed by resistance at 0.0361 BTC (March 2019 High), 0.0371 BTC (bearish .618 Fib Retracement), and 0.038 BTC.
On the other side, the first level of support lies at 0.0347 BTC. This is followed by added support at 0.0337 BTC (March 2019 Support), 0.0329 BTC (.5 Fib Retracement), and 0.032 BTC.
Ripple
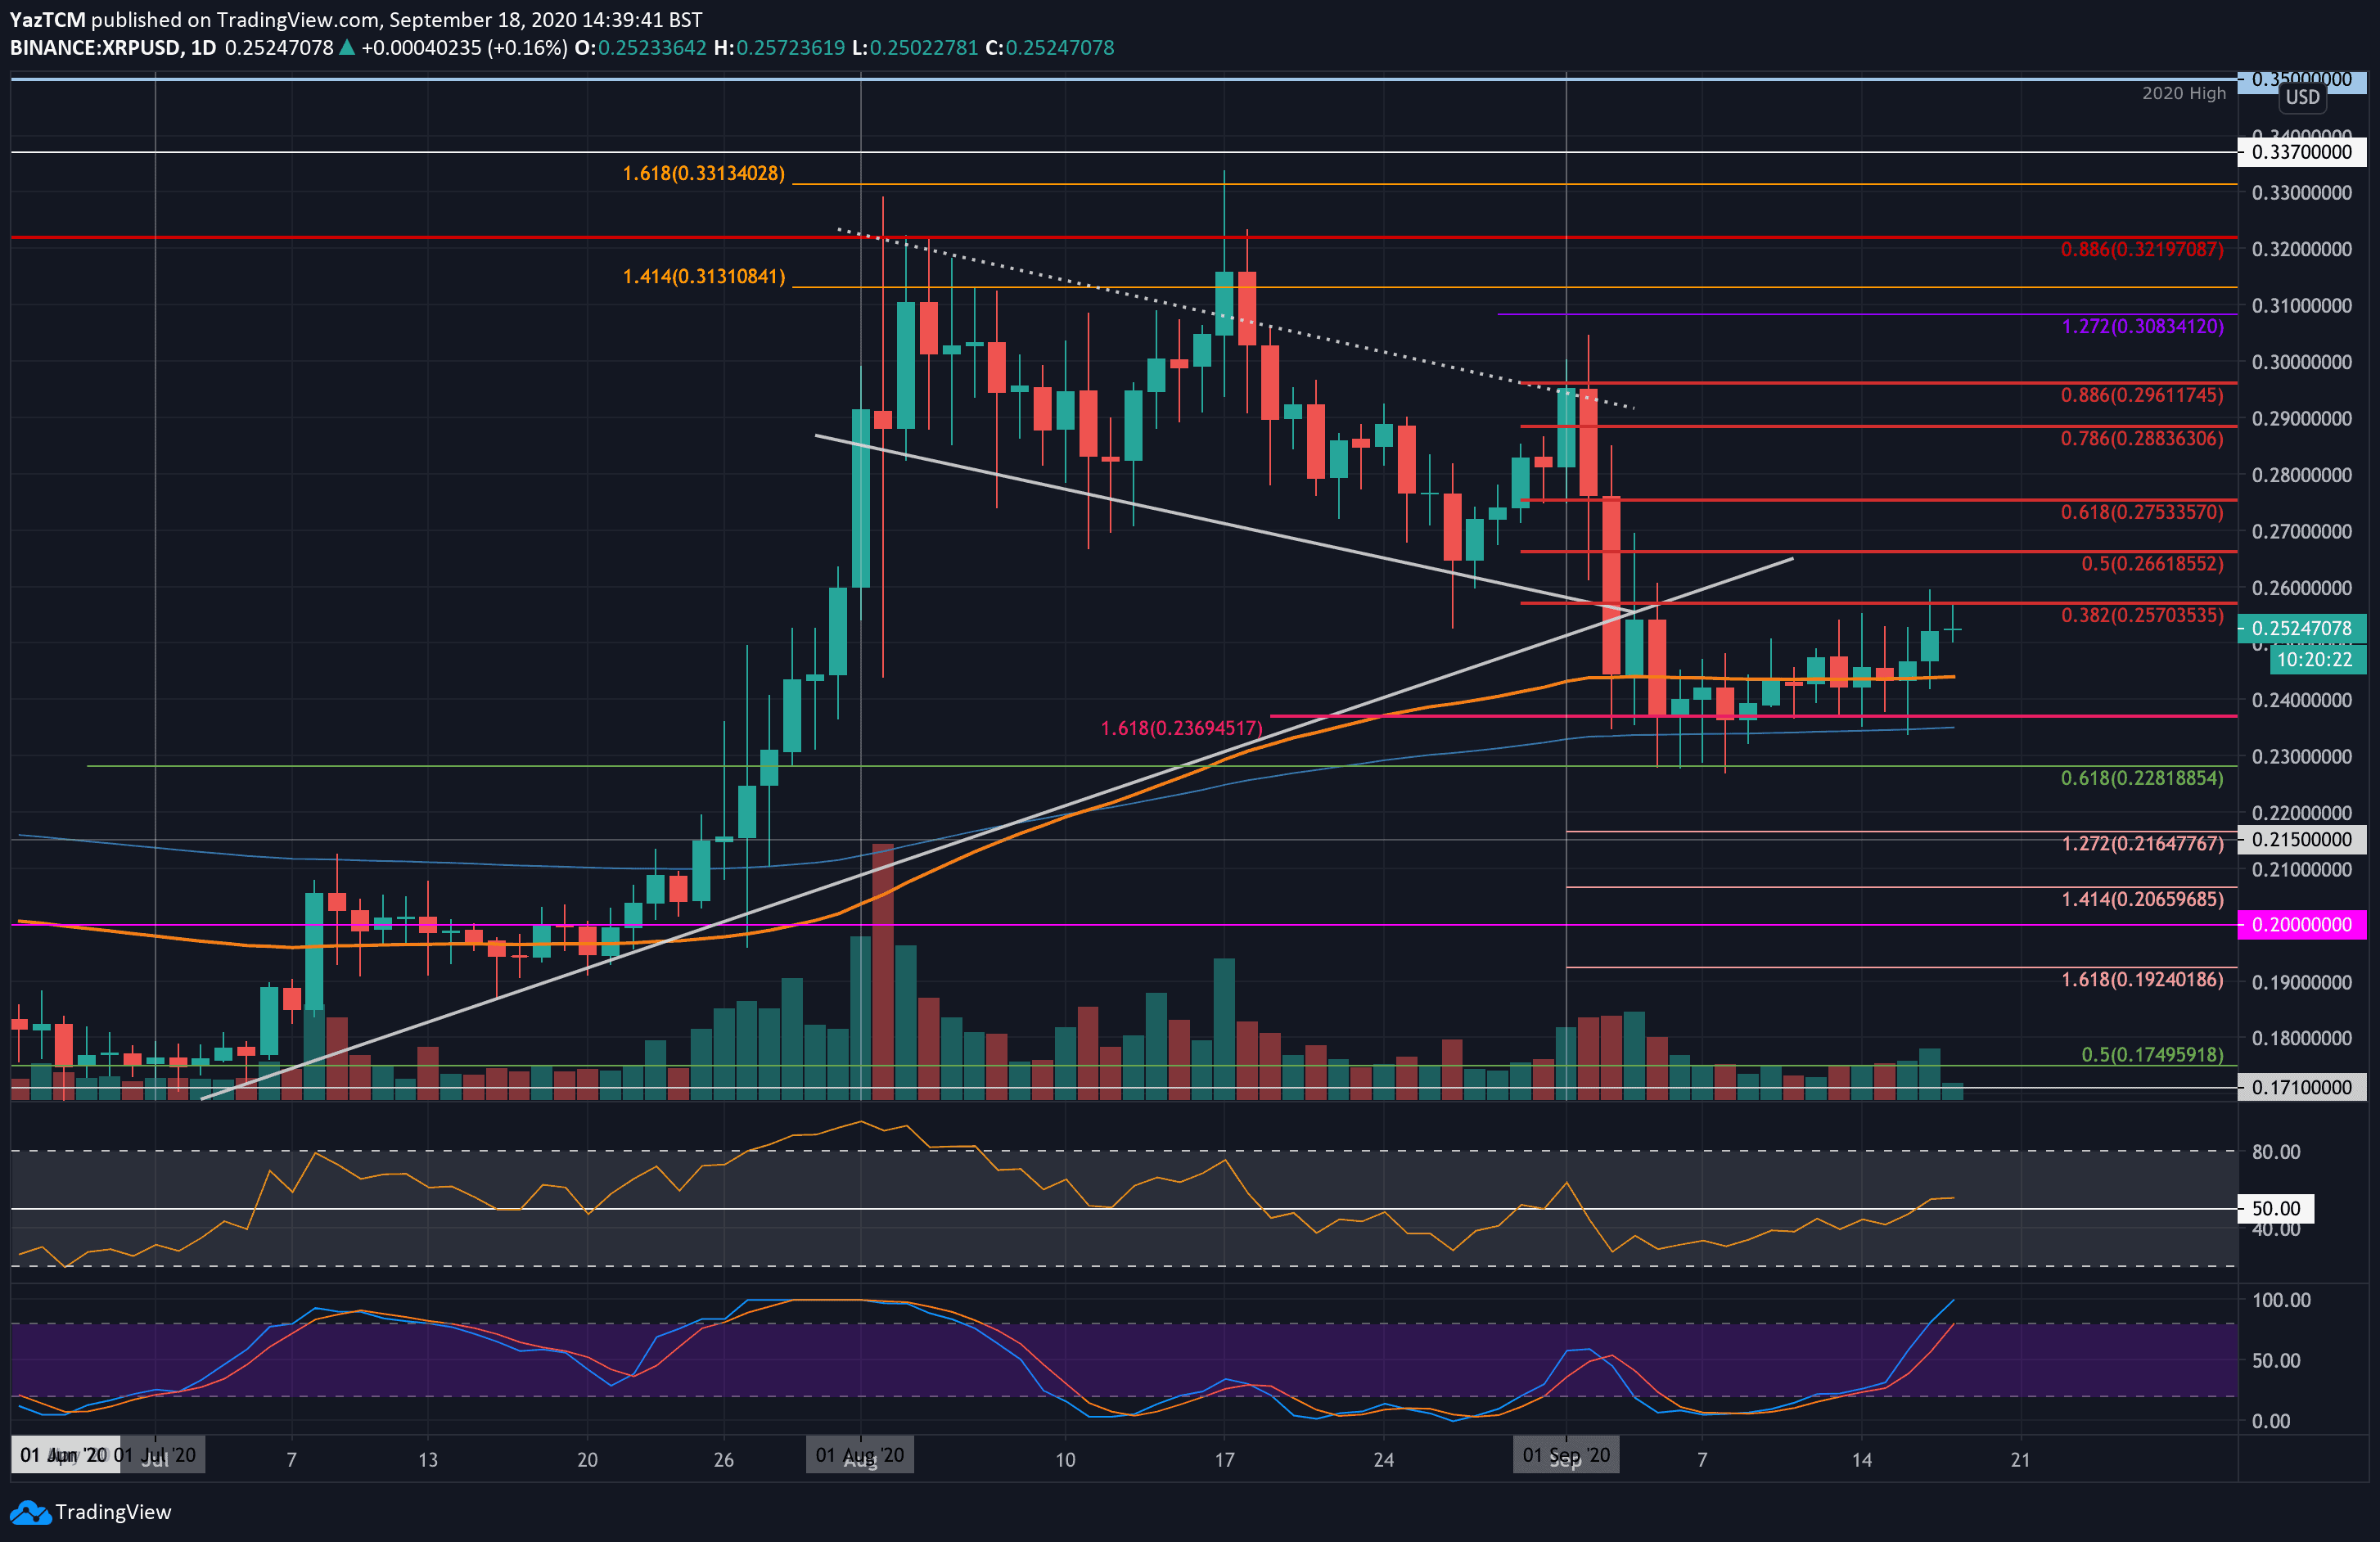
XRP saw a small 3.4% price rise over the last week of trading as it reached $0.252 today. The coin broke above the 100-days EMA last Friday, but it struggled to make any ground above $0.25. Throughout the entire week, XRP remained rangebound between $0.25 and $0.24.
This range was penetrated yesterday when XRP finally climbed above the $0.25 level. However, it was unable to penetrate the resistance at $0.257 (bearish .382 Fib Retracement).
Looking ahead, the first level of resistance to break lies at $0.257 (bearish .382 Fib Retracemnet). This is followed by resistance at $0.266 (bearish .5 Fib Retracement), $0.275 (.618 Fib Retracement), $0.28, and $0.288 (bearish .786 Fib Retracement).
On the other side, the first level of support lies at $0.25. This is followed by support at $0.244 (100-days EMA), $0.236, and $0.228 (.618 Fib Retracement).
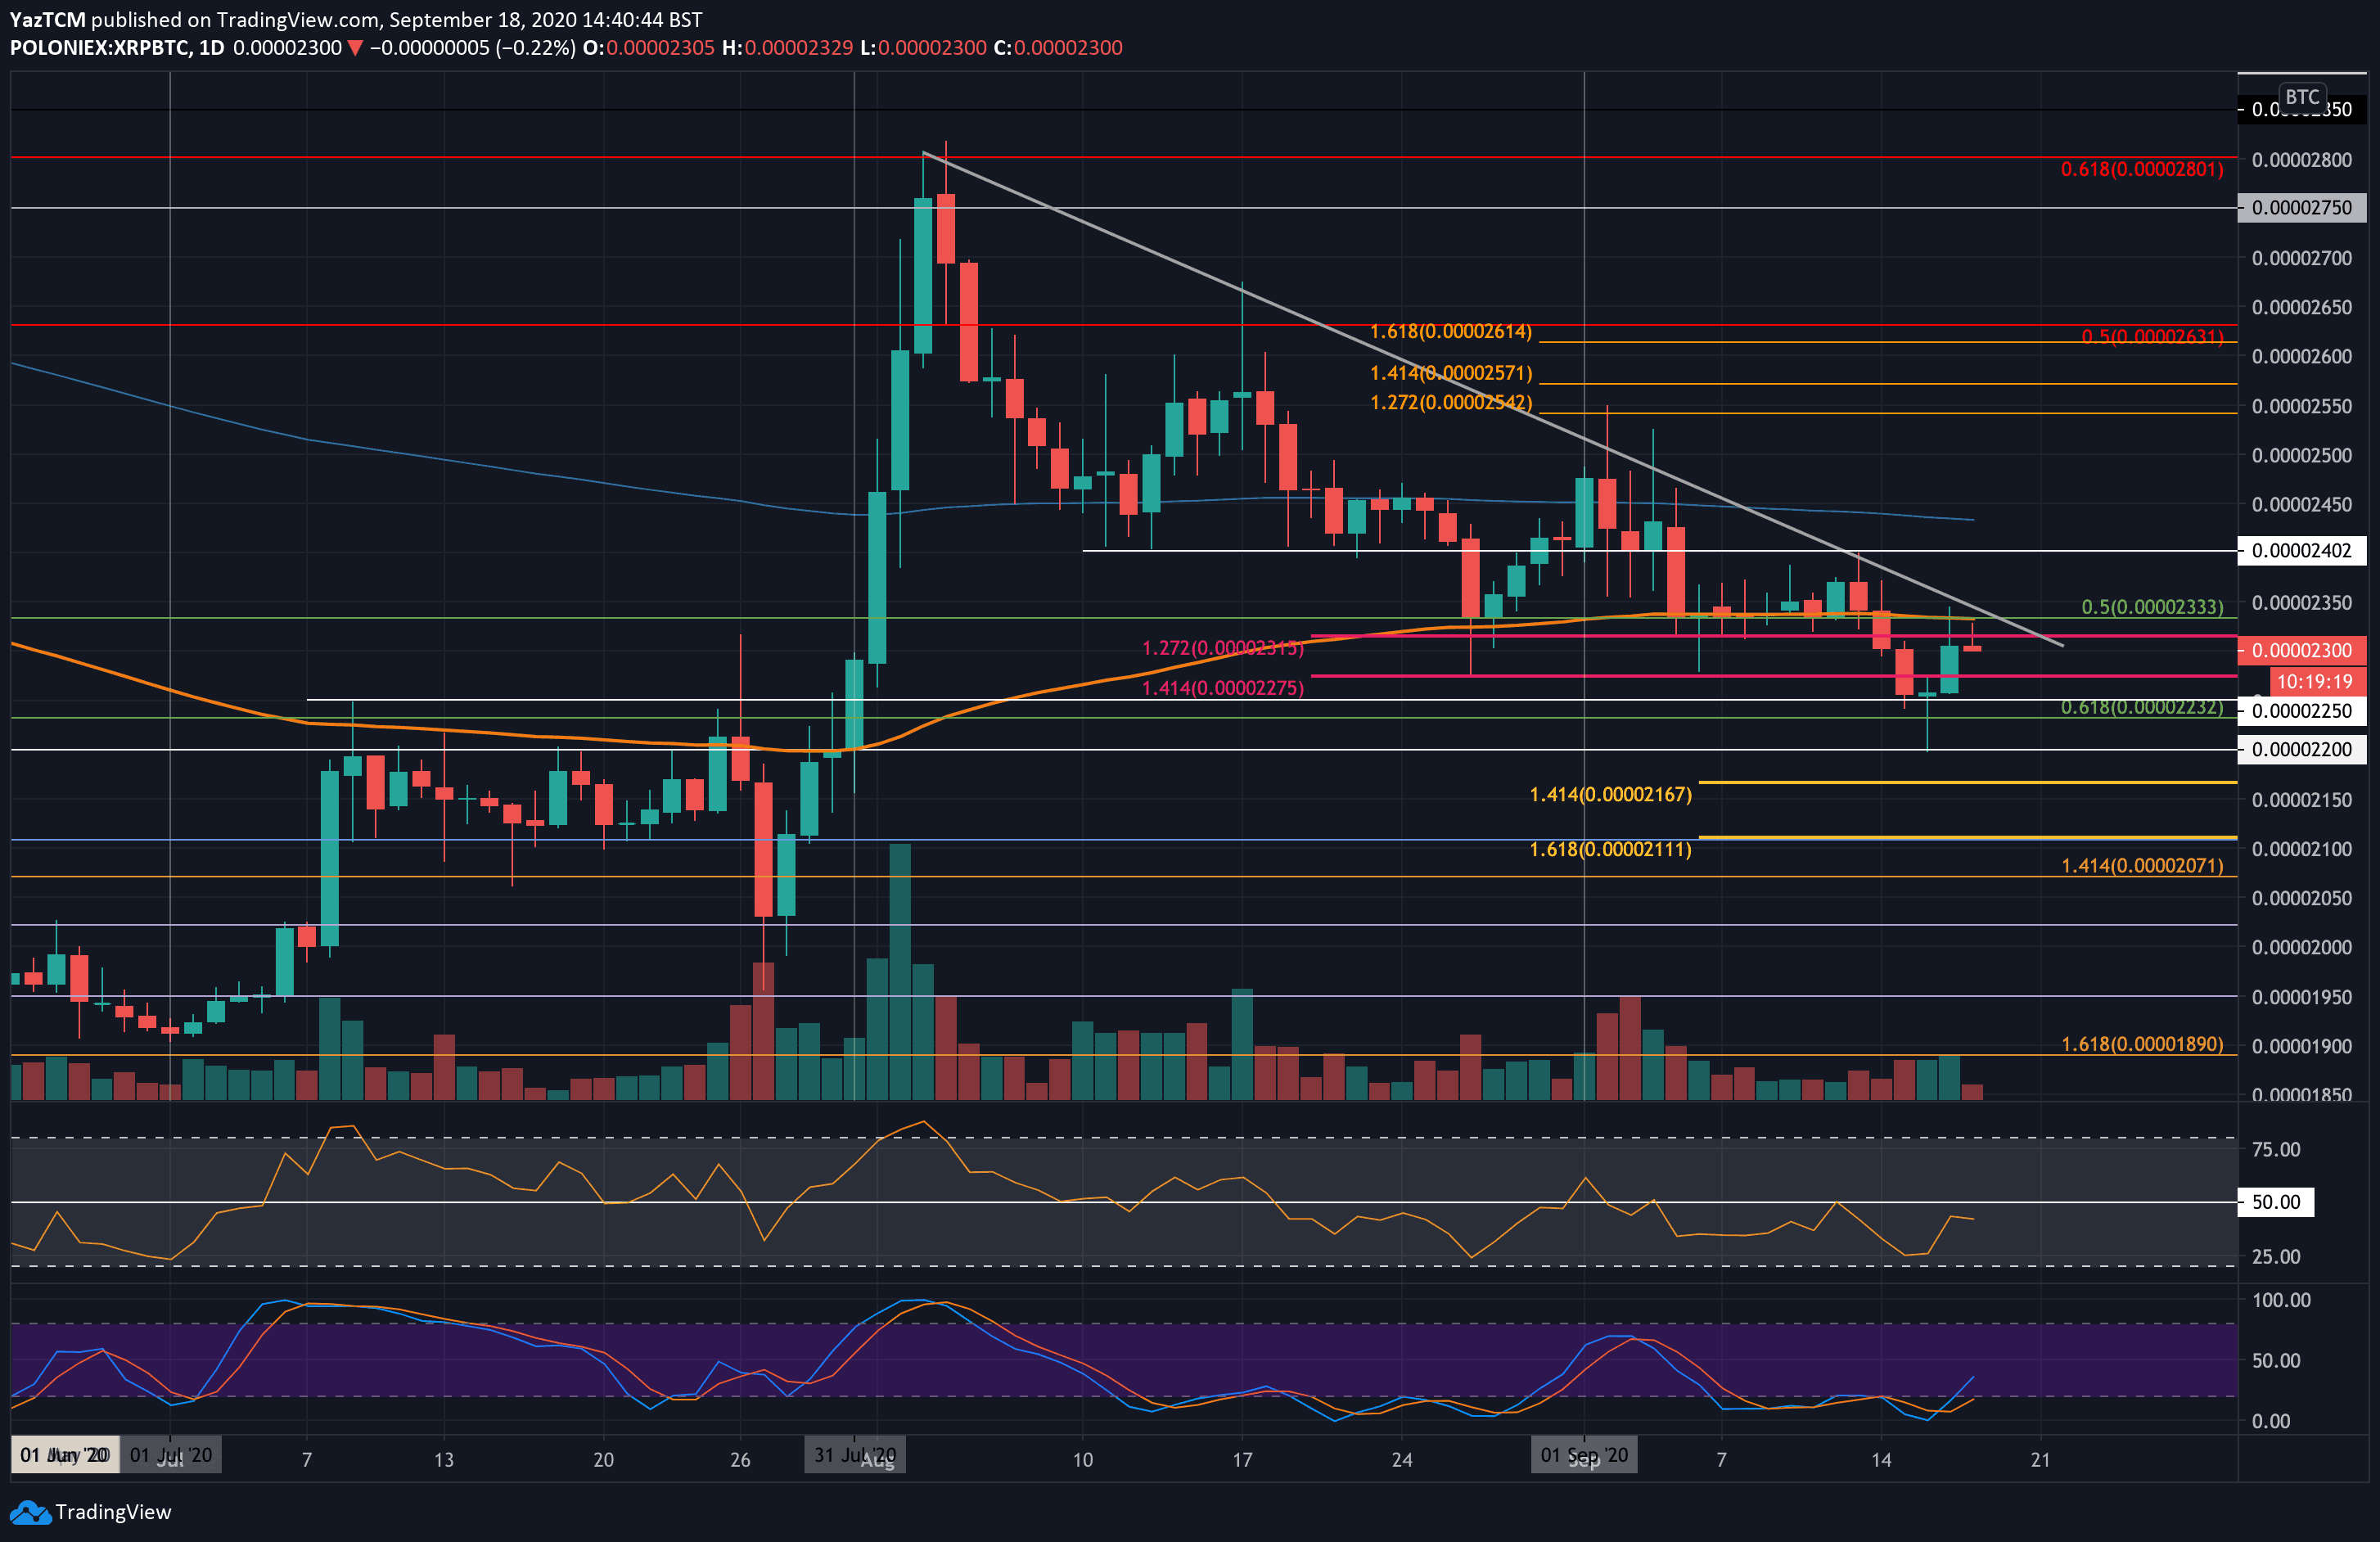
XRP suffered quite heavily against Bitcoin this week. The coin failed to overcome resistance at a falling trend line at around 2400 SAT last Friday, which caused it to head lower over the weekend. It went on to break beneath the 100-days EMA as it continued to spike as low as 2200 SAT on Wednesday.
The bulls have since rebounded from here as XRP trades at 2300 SAT, but the outlook still looks pretty bearish unless the buyers can bring XRP above 2400 SAT.
Moving forward, if the sellers continue to drive XRP lower, the first level of support lies at 2250 SAT. This is followed by support at 2200 SAT, 2167 SAT (downside 1.414 Fib Extension), and 2111 SAT (downside 1.618 Fib Extension).
Binance Coin
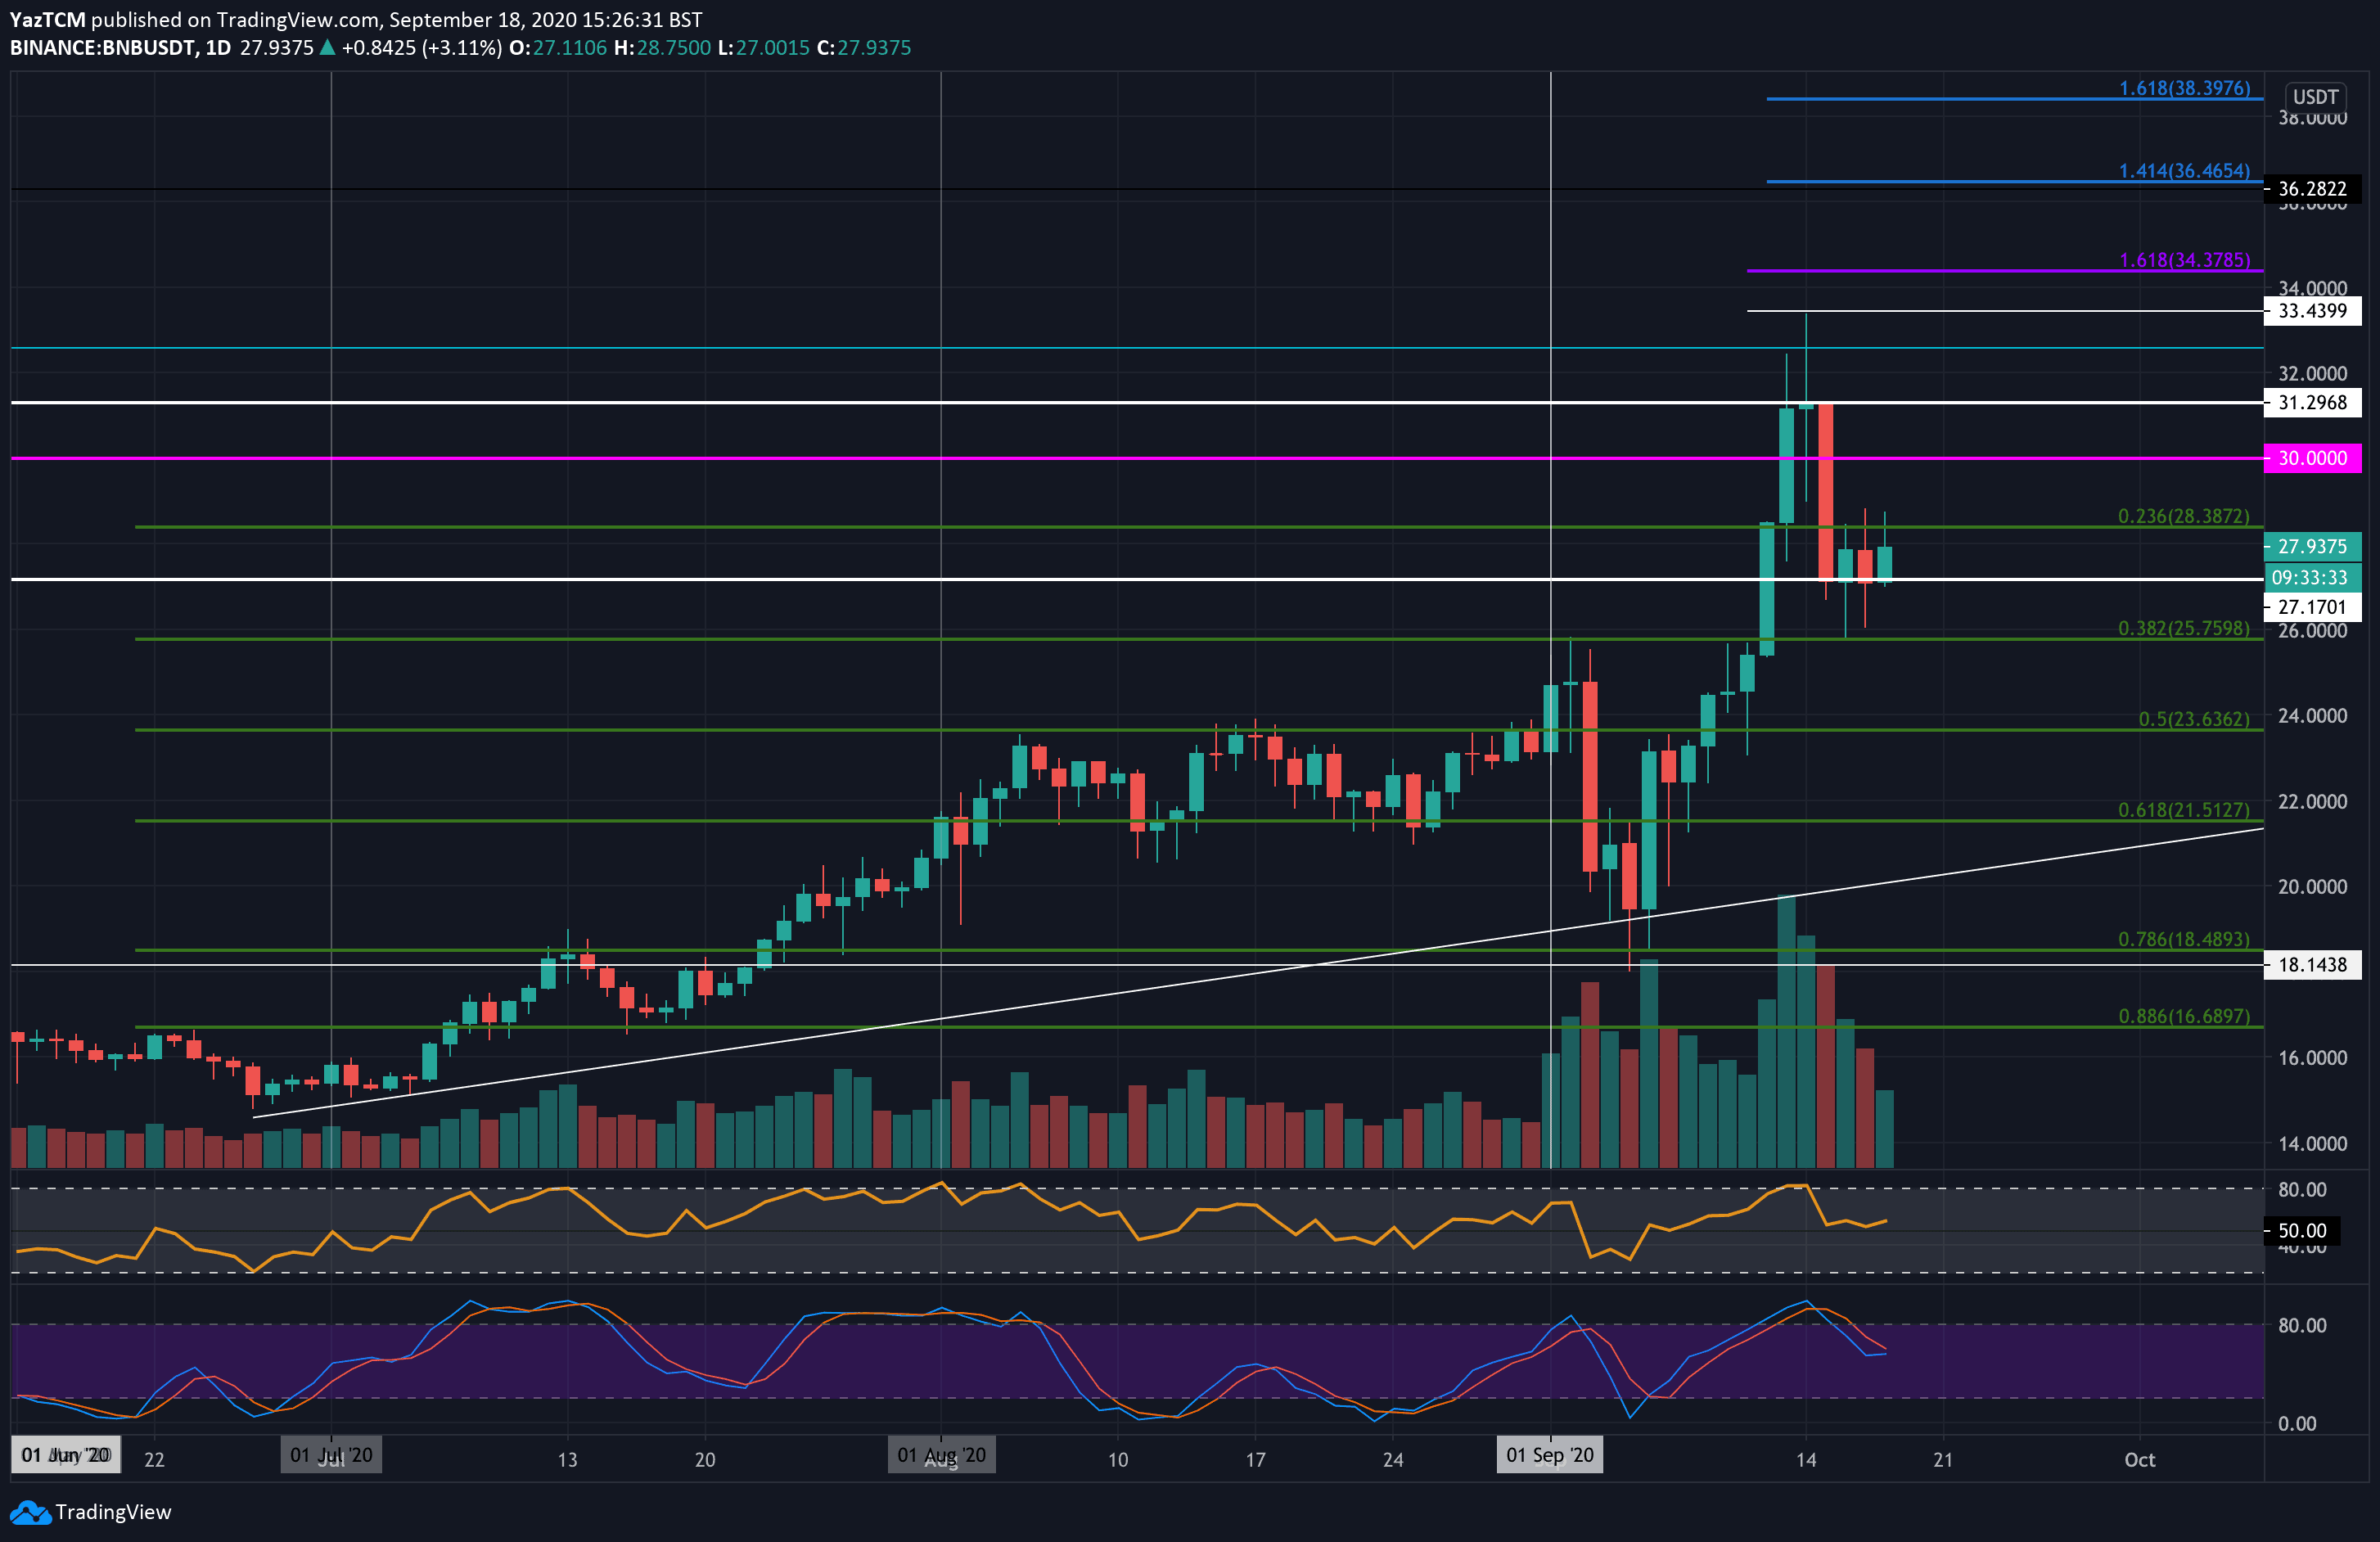
Binance Coin saw a healthy 14.1% price surge this week as it hits the $27.93 level today. The coin was trading beneath $26 last Friday as it started to surge higher. Over the weekend, BNB reached as high as $33.44 before it rolled over and started to drop.
Luckily, it found strong s support at the $27.17 region after spiking lower unto the $25.75 level (.382 Fib Retracement). The bulls have defended $27.17 over the past 4-days and have attempted to rebound from here today.
Looking ahead, the first level of resistance to climb above lies at $29. This is followed by resistance at $30, $21.30, and $33.43. Additional resistance lies at $34, $34.37, and $36.
On the other side, the first level of support lies at $27.17. Beneath that, support lies at $25.75 (.382 Fib Retracement), $25, $23.63 (.5 Fib Retracement), and $22.
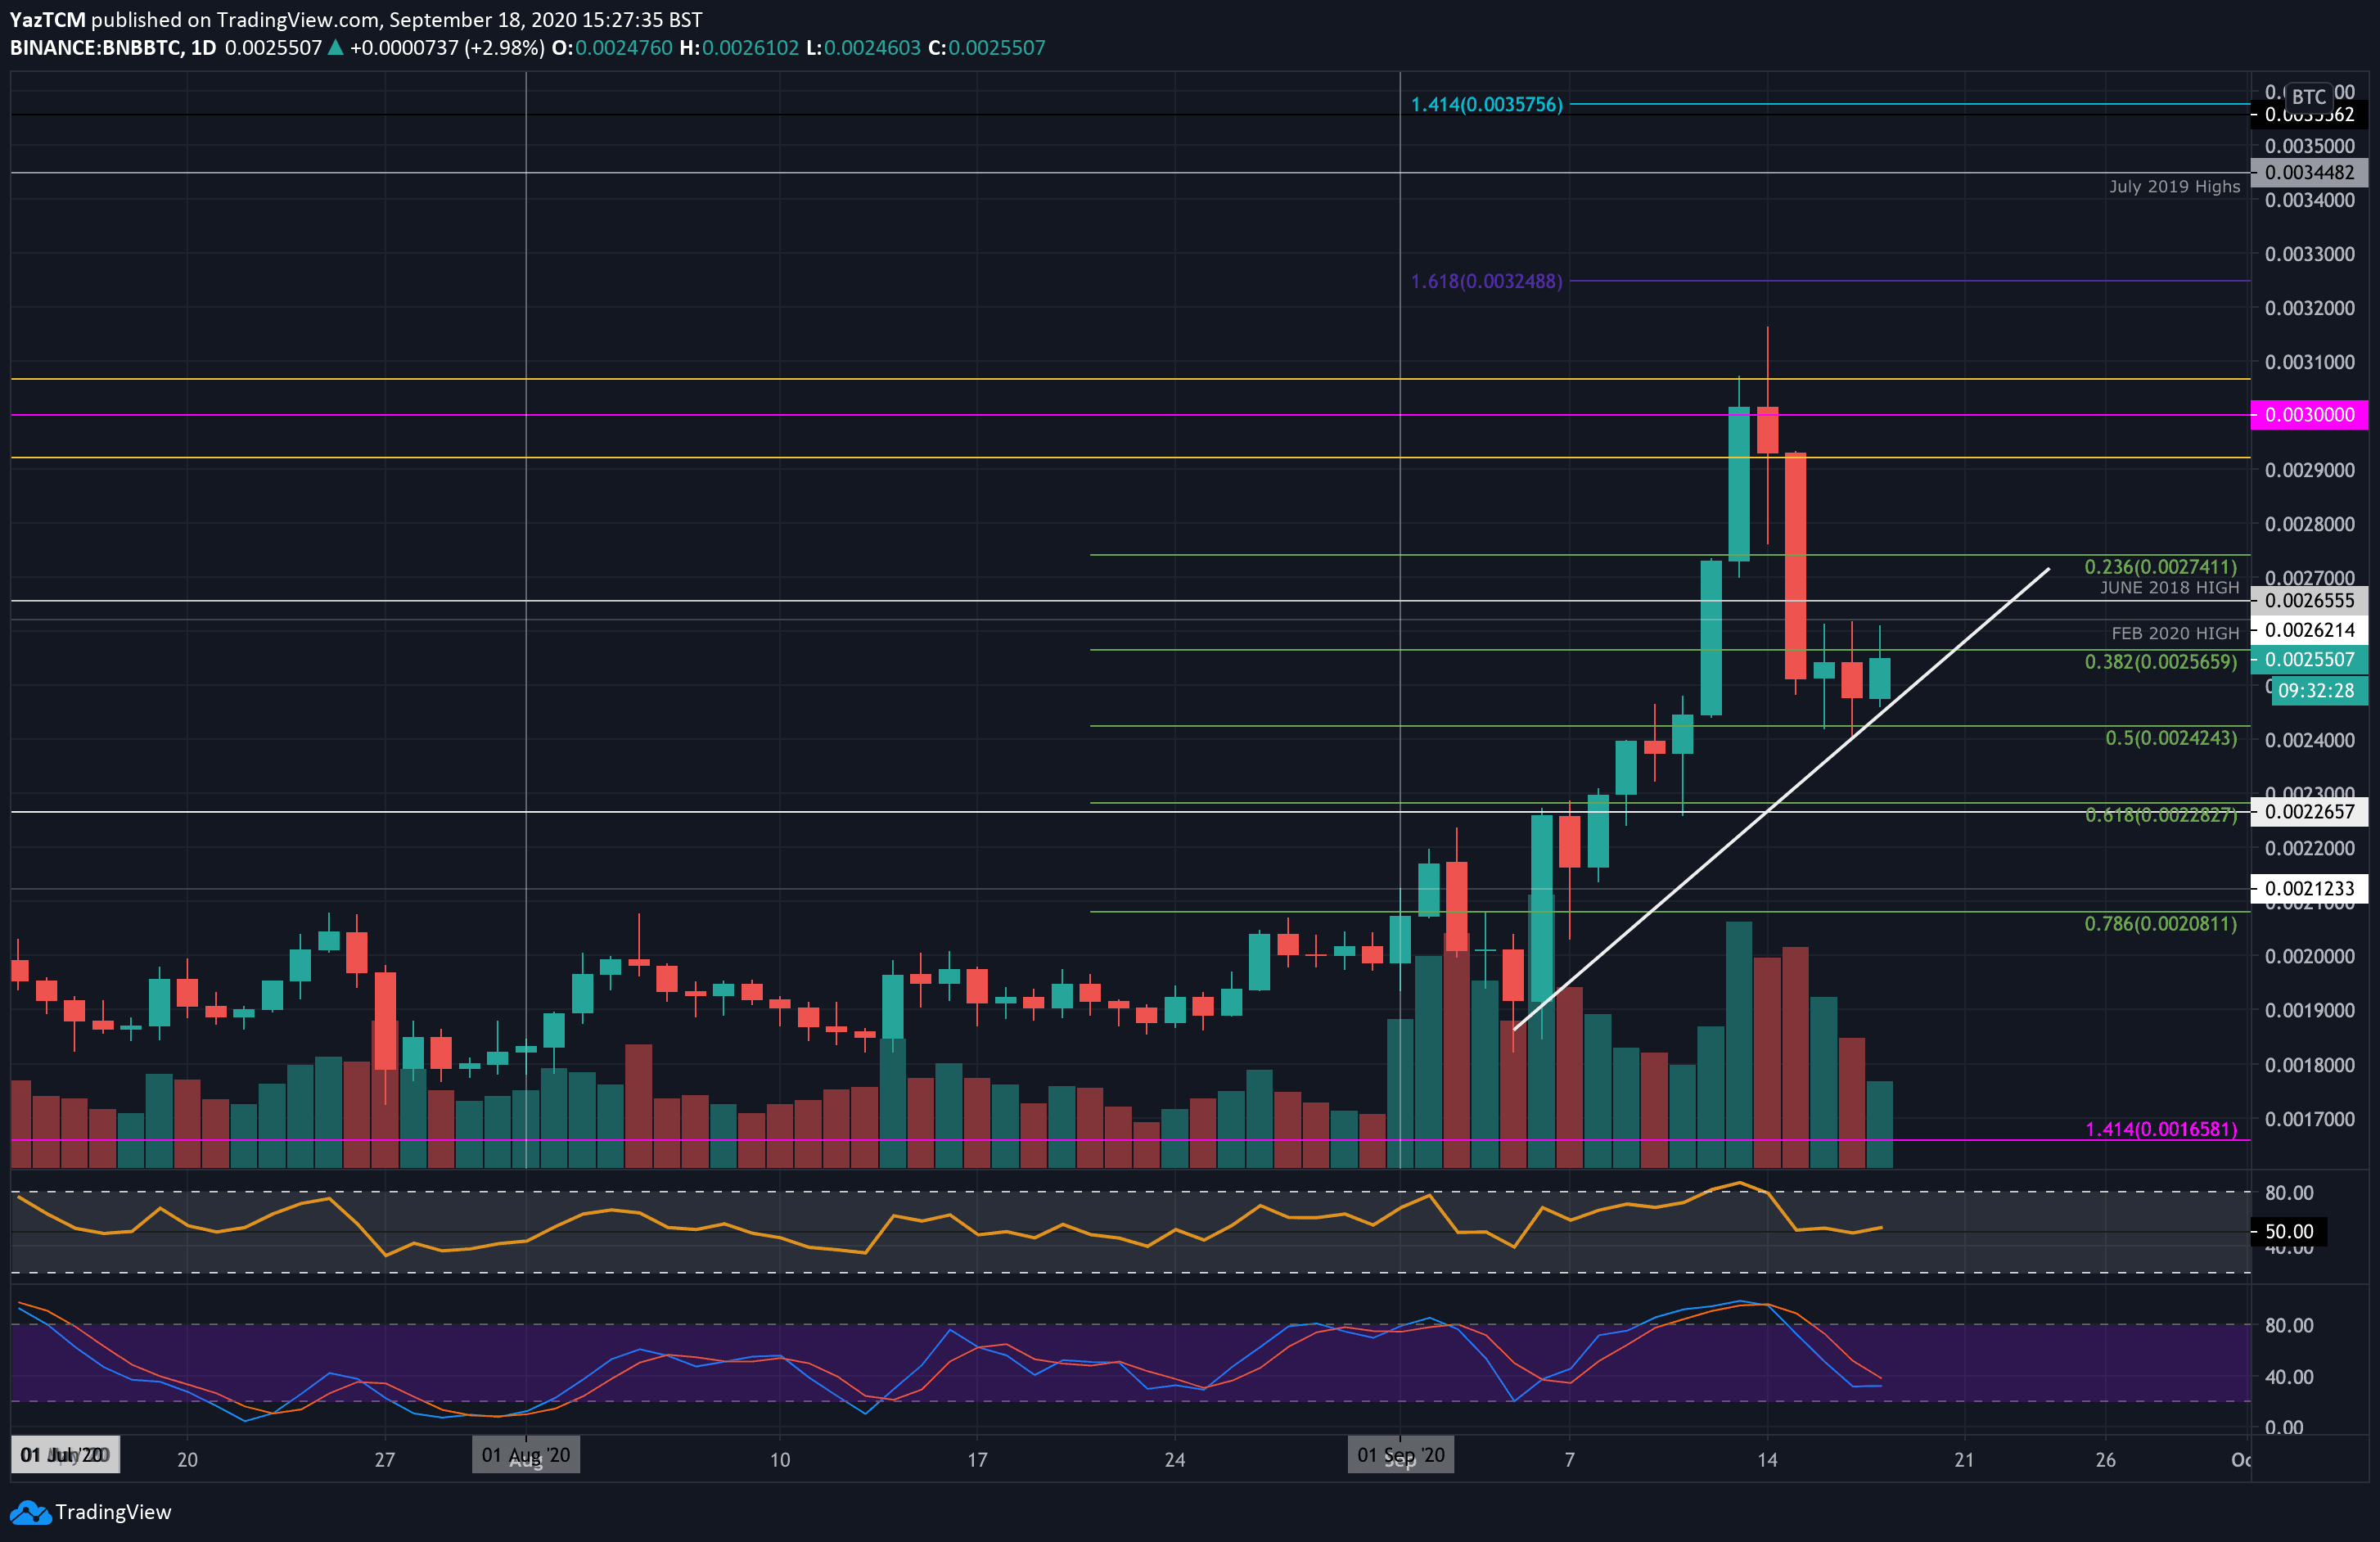
The situation is relatively similar for BNB/BTC. The coin was trading at 0.0024 BTC last Friday as it surged higher into the 0.003 BTC level. From there, it plummeted lower until support was found at 0.00242 BTC (.5 Fib Retracement). A rising trend line bolsters the support here.
Looking ahead, the first level of resistance to break lies at 0.00262 BTC (Feb 2020 High). Above this, resistance lies at 0.00265 BTC (June 2018 High), 0.0028 BTC, and 0.003 BTC.
On the other side, the first level of support lies at the rising trend line. Beneath this, support lies at 0.00242 BTC (.5 Fib Retracement), 0.00228 BTC (.618 Fib Retracement), and 0.0022 BTC.
Polkadot
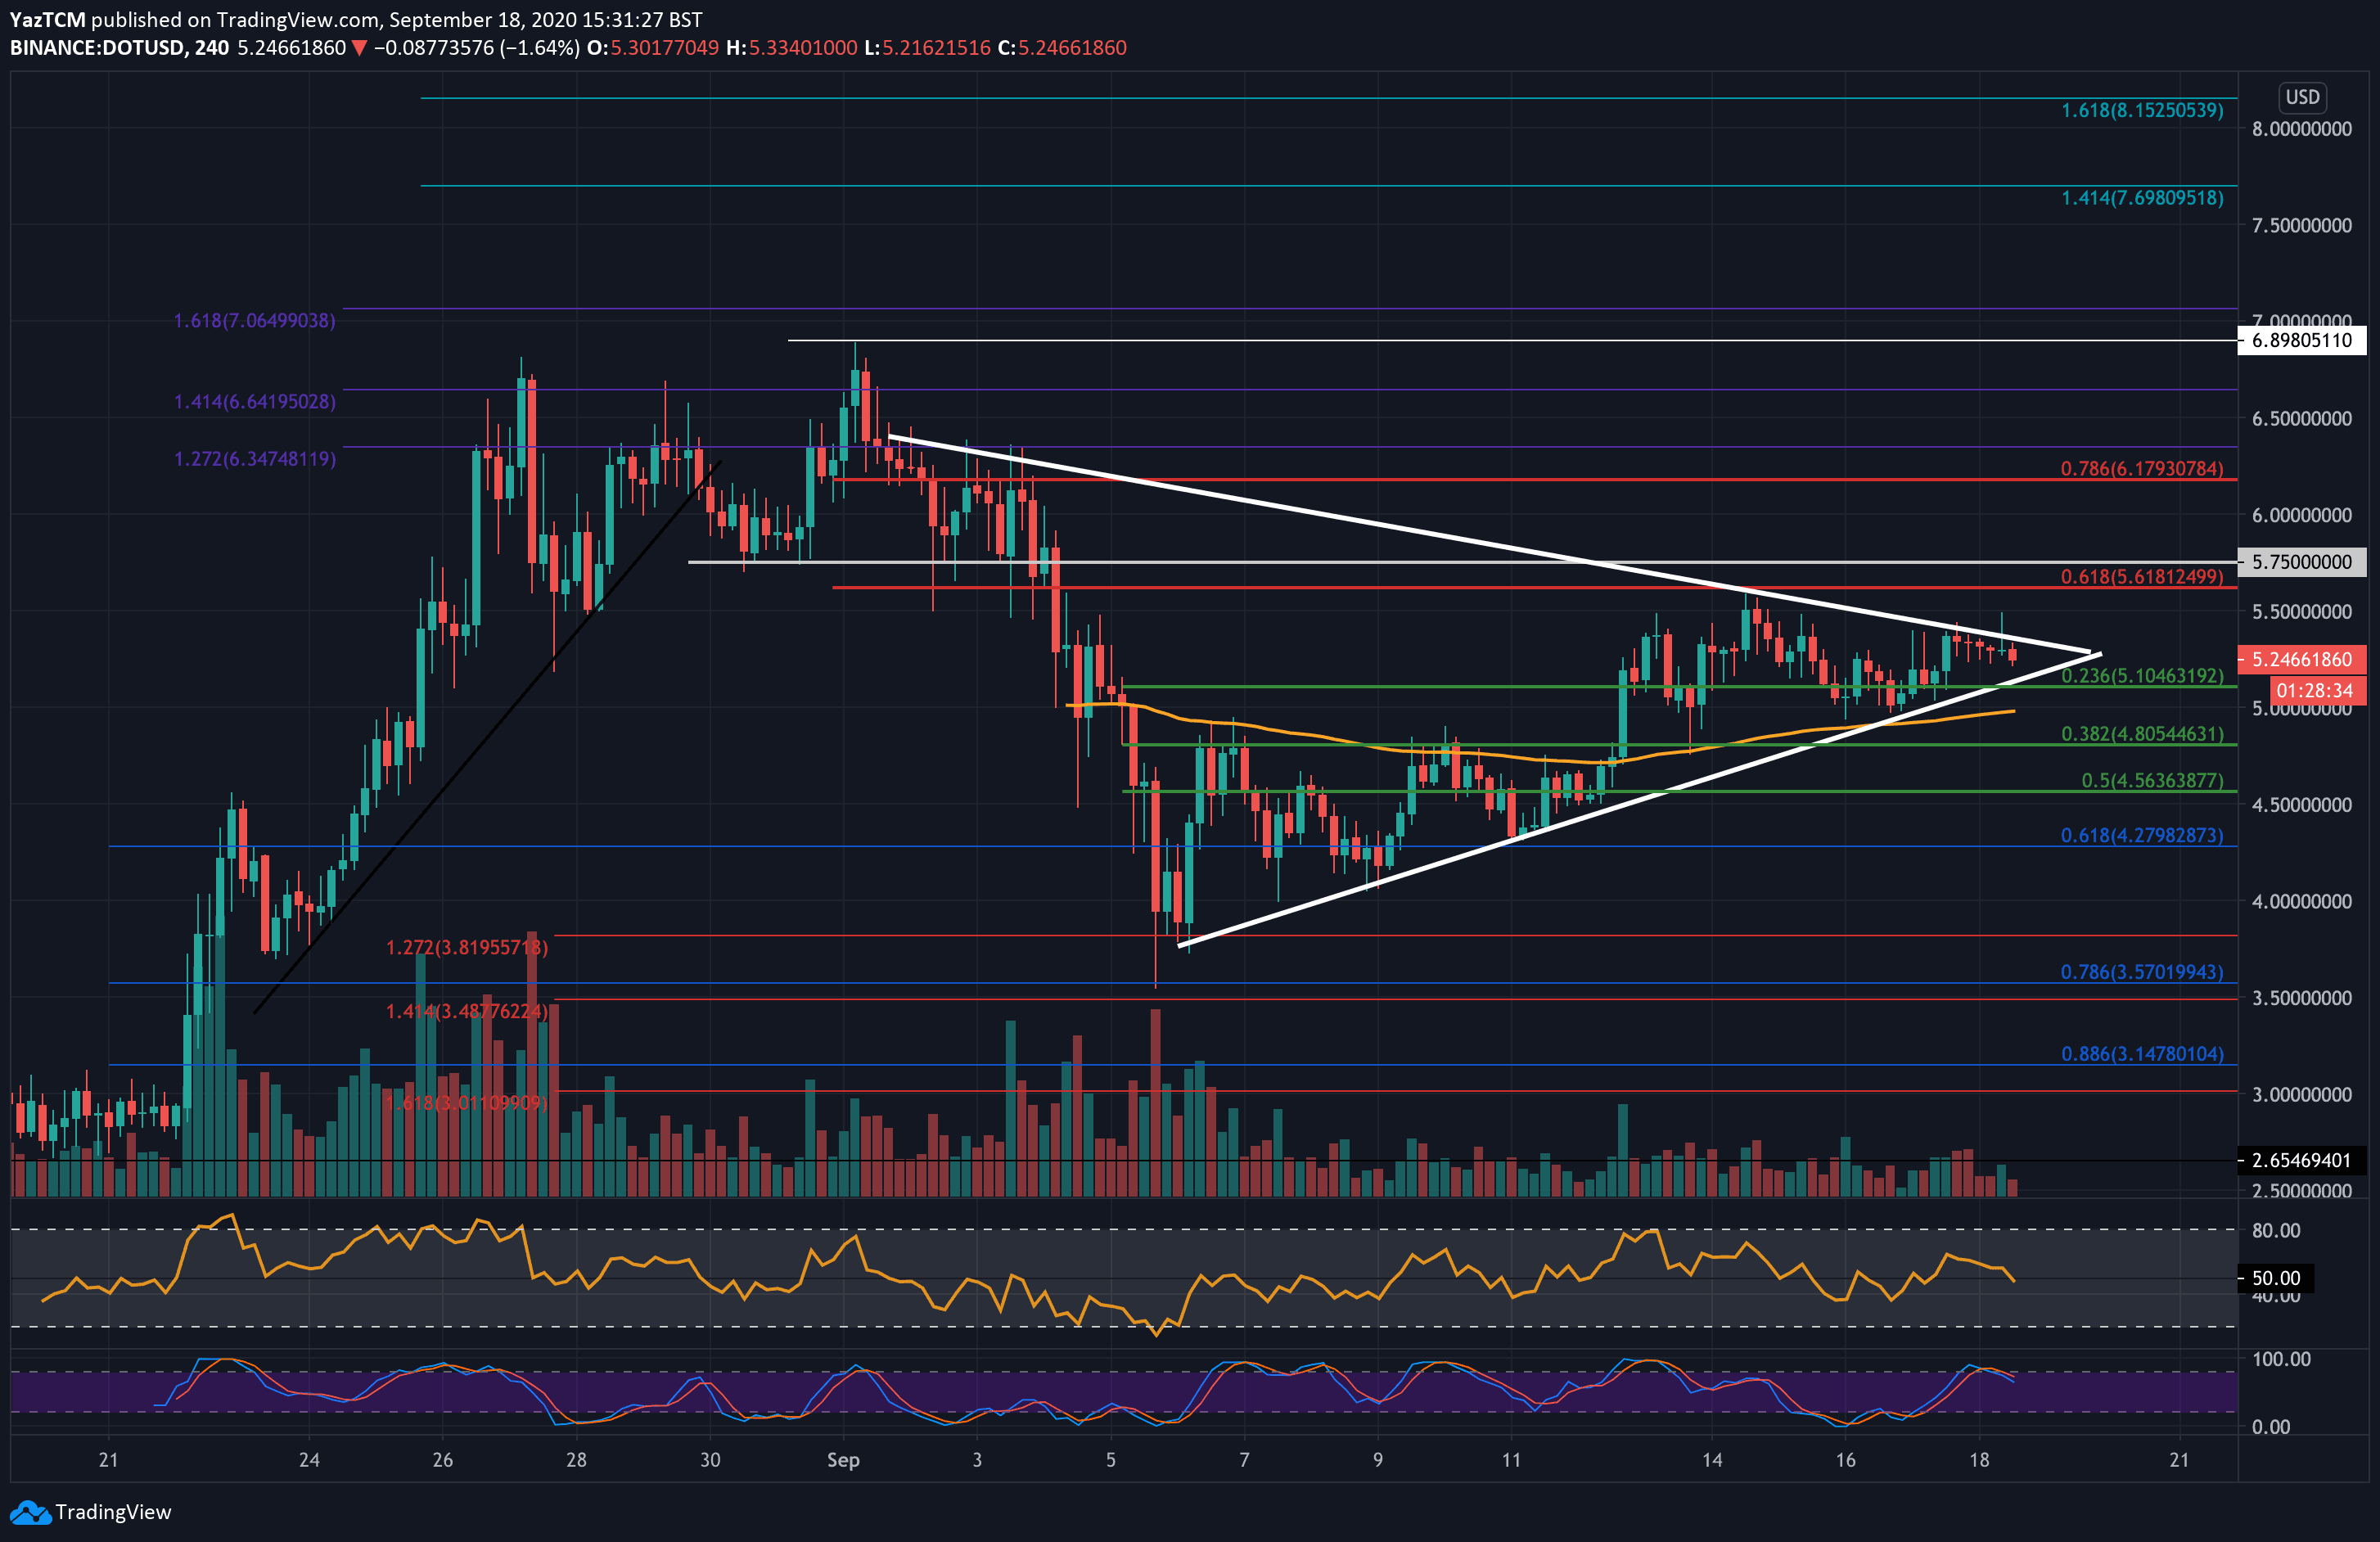
Polkadot saw a strong 15.4% price increase this week as the coin rises into the $5.25 level. The cryptocurrency had dropped lower from the $6.90 level at the start of September and continued to fall until support was found at $3.81 (downside 1.272 Fib Extension). From there, it managed to rebound as it started to form a symmetrical triangle pattern.
DOT is now at the apex of this symmetrical triangle, where a breakout is expected in either direction to dictate the next bearing for the market.
IF the bulls can break the upper boundary of the triangle, the first level of resistance lies at $5.61 (bearish .618 Fib Retracement). This is followed by resistance at $6.00, $6.17 (bearish .786 Fib Retracement), $6.65 (1.414 Fib Extension), and $7.00 (1.618 Fib Extension).
On the other side, the first level of support lies at the lower boundary of the triangle. Beneath this, support lies at $5.10 (.236 Fib Retracement), $5.00, $4.80 (.382 Fib Retracement), and $4.56 (.5 Fib retracement).
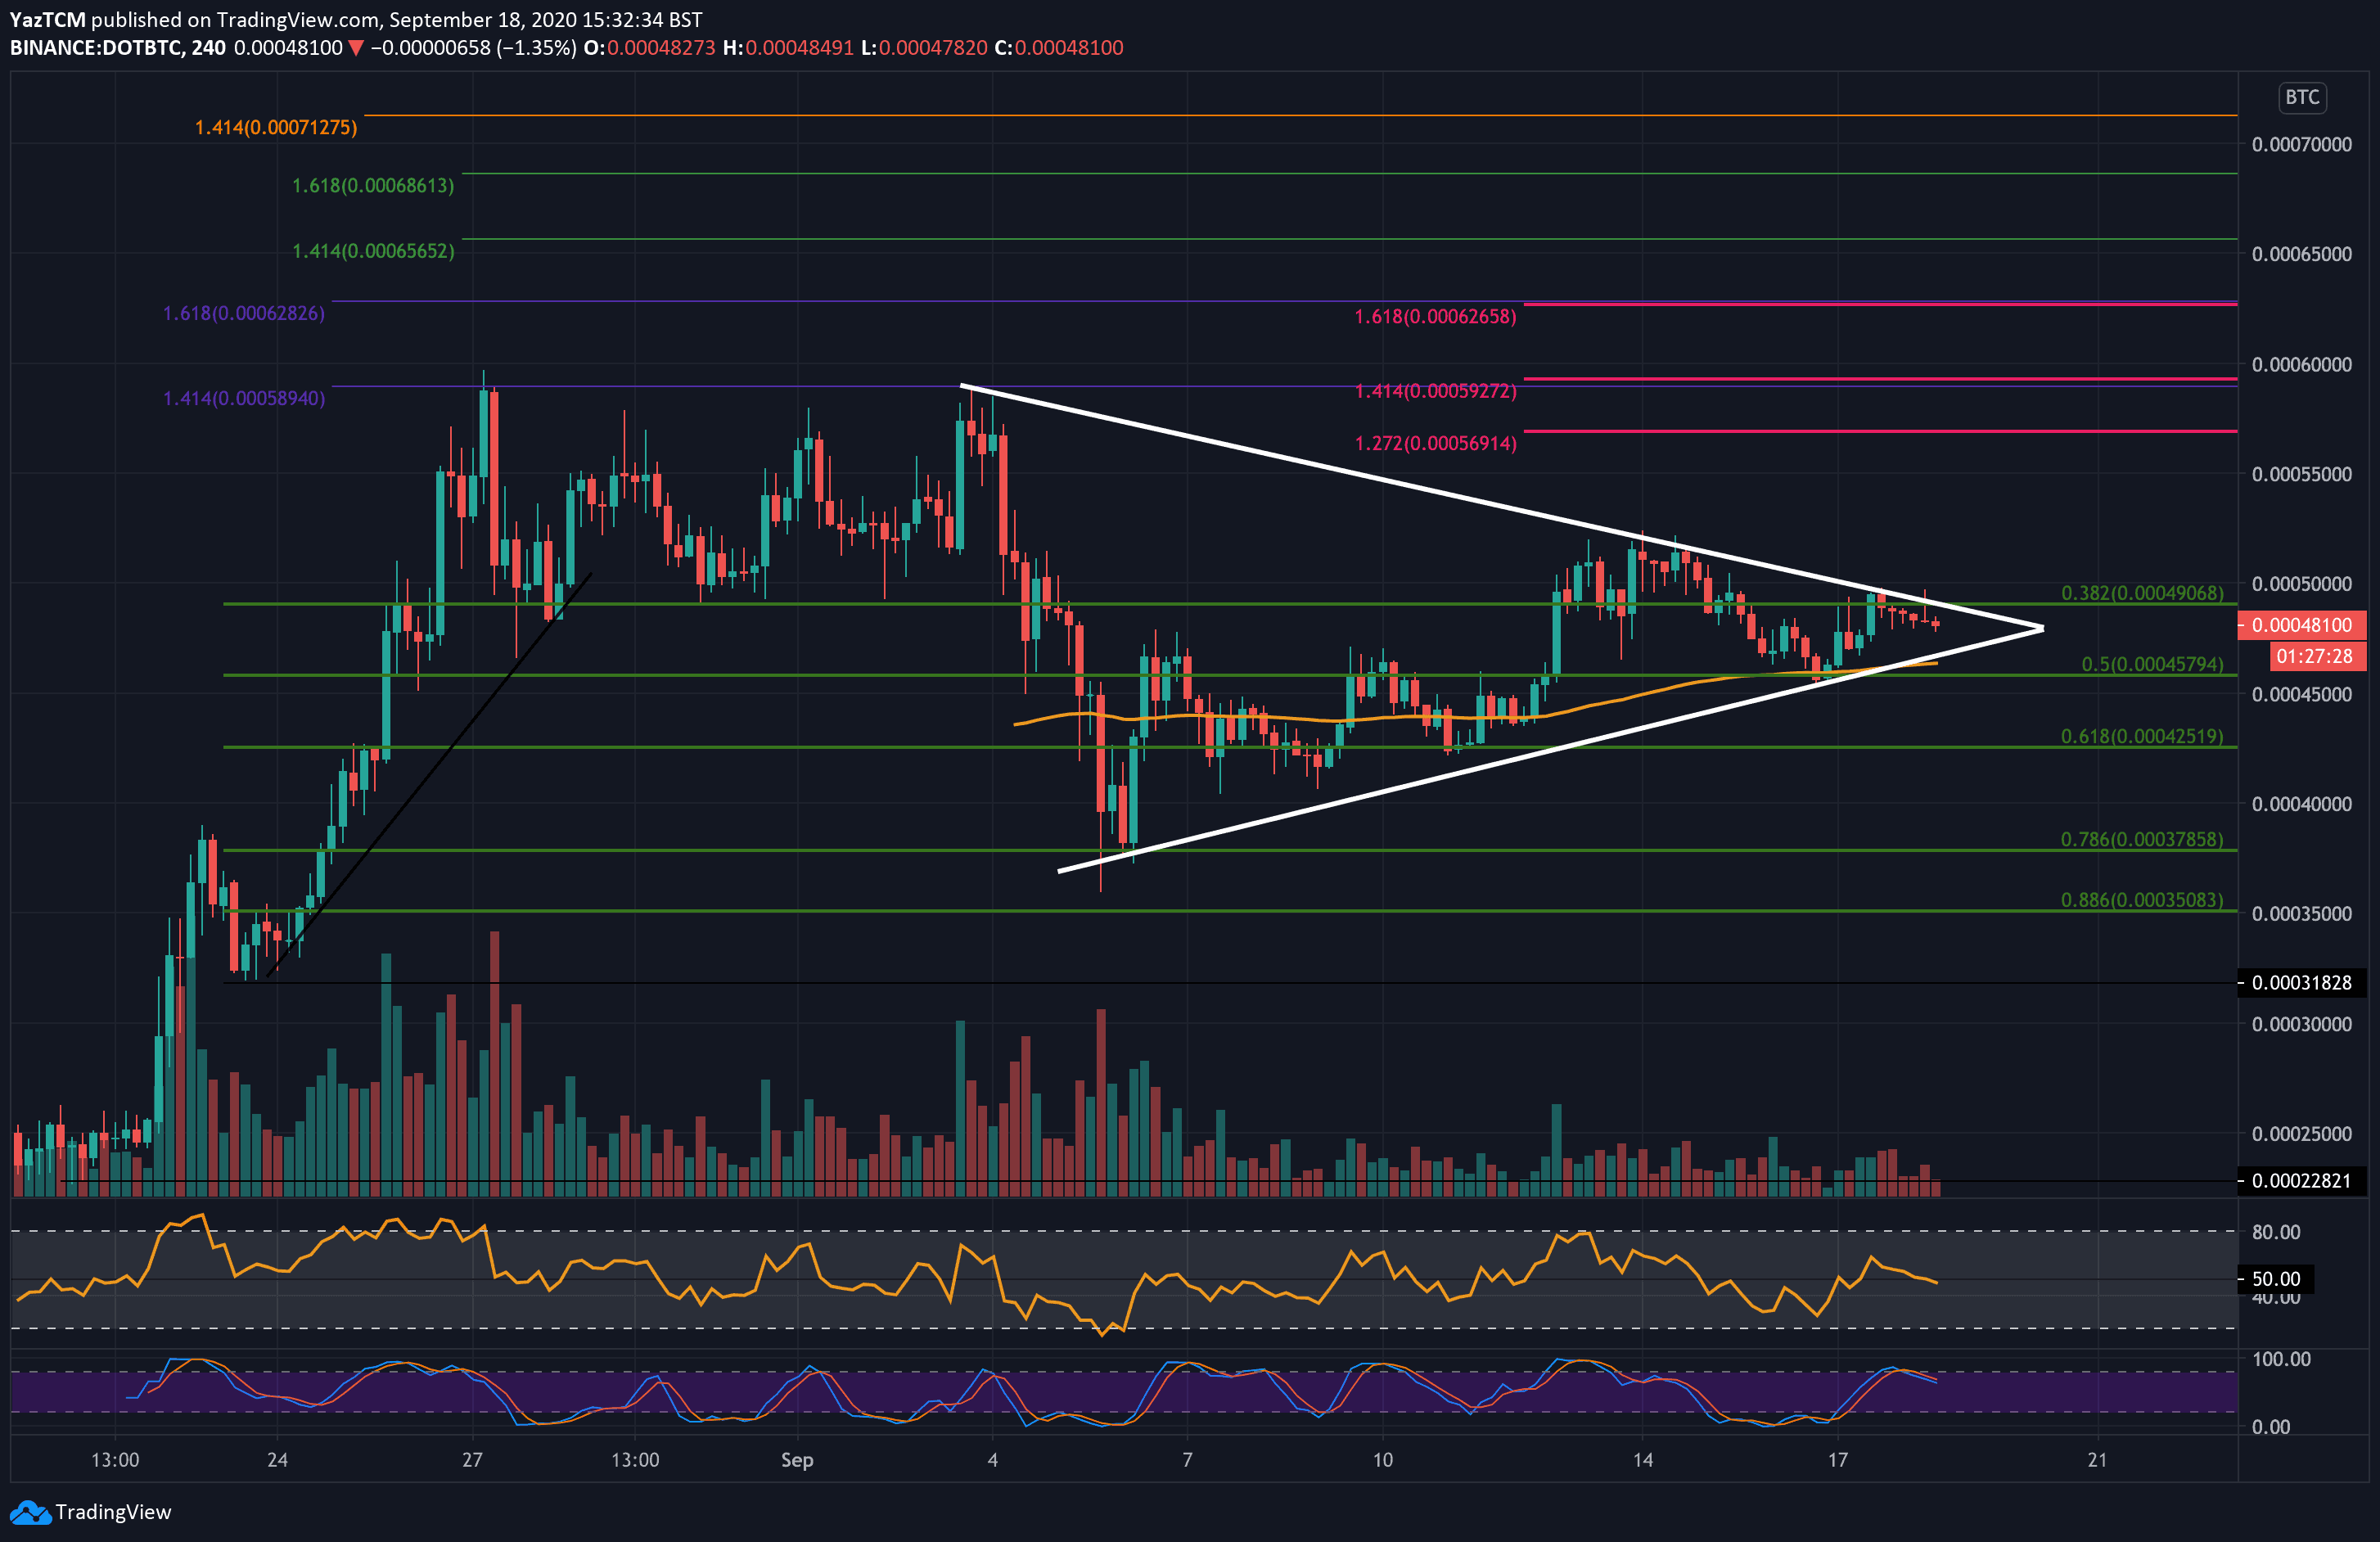
Against Bitcoin, DOT is also in a symmetrical triangle as it trades at 48,100 SAT. The coin fell from 59,000 SAT at the start of September until support was reached at the 37,900 SAT (.786 Fib Retracement).
DOT rebounded from this support as it slowly pushed higher within the confines of the symmetrical triangle.
Looking ahead, if the bulls break the upper boundary of the triangle, the first level of resistance lies at 52,500 SAT. Above this, resistance lies at 55,000 SAT, 57,000 SAT (1.272 Fib Extension), and 60,000 SAT.
On the other side, support lies at 45,800 SAT, 45,000 SAT, 42,500 SAT, and 40,000 SAT.
Binance Futures 50 USDT FREE Voucher: Use this link to register & get 10% off fees and 50 USDT when trading 500 USDT (limited – first 200 sign-ups & exclusive to CryptoPotato).
Click here to start trading on BitMEX and receive 10% discount on fees for 6 months.
Disclaimer: Information found on CryptoPotato is those of writers quoted. It does not represent the opinions of CryptoPotato on whether to buy, sell, or hold any investments. You are advised to conduct your own research before making any investment decisions. Use provided information at your own risk. See Disclaimer for more information.
Cryptocurrency charts by TradingView.
