Ethereum Price Analysis: ETH Facing Critical Decision Amid Key Support Line
Like many other large-caps, which are highly correlated with bitcoin’s recent price action, Ethereum is trading amid long-term support – a fragile situation. However, investors are still looking at the market in doubt.
Considering the minor amounts of trading volume at two of the significant US-based exchanges – Binance US and Coinbase – it seems that investors are still waiting for the Federal Reserve’s decisions.
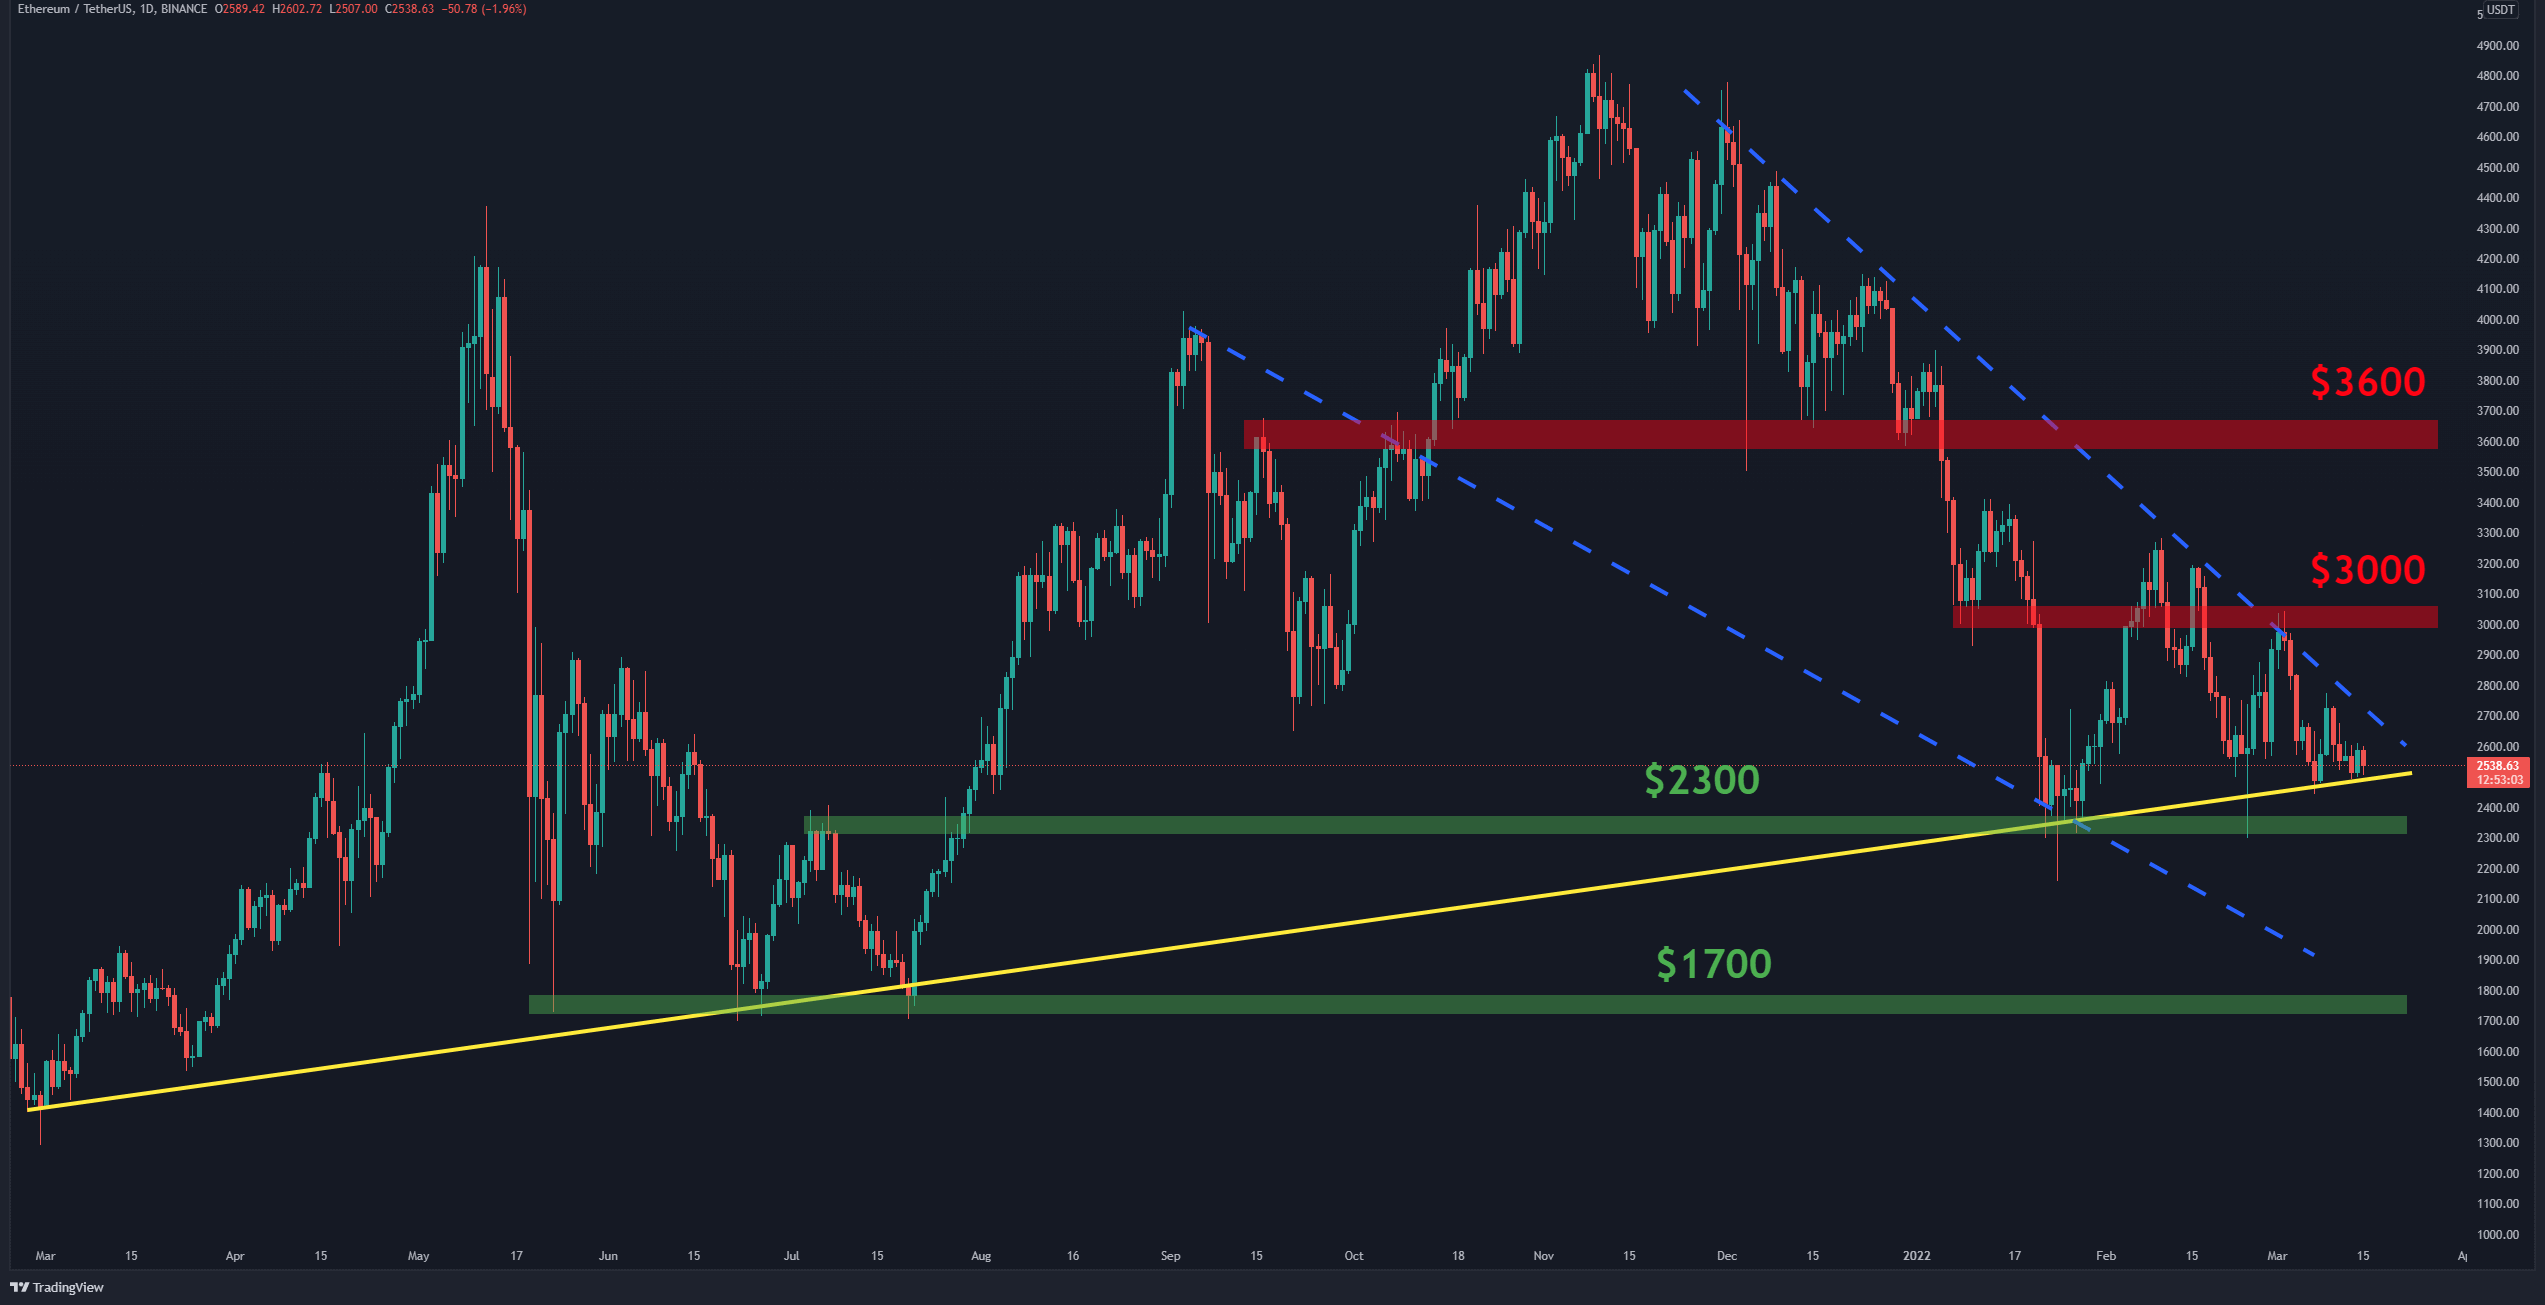
Support levels: $2300 & $1700
Resistance levels: $2650 , $3000 & $3600
The Daily Chart
Technical analysis by Grizzly
On the daily chart, despite the price being on top of its dynamic support (marked by the yellow trendline), it moves down inside a falling wedge (marked by blue).
Therefore, it seems that ETH is getting closer to deciding on its next major move. From the bullish side, the price needs to break above the resistance at $2650 and then cross the critical resistance at $3000, forming a higher high to encourage investors who are currently hesitant to enter the market.
On the other hand, if the long-lasting support fails and ETH goes below $2300, then sub-$2K levels likely occur.
The 4-Hour Chart
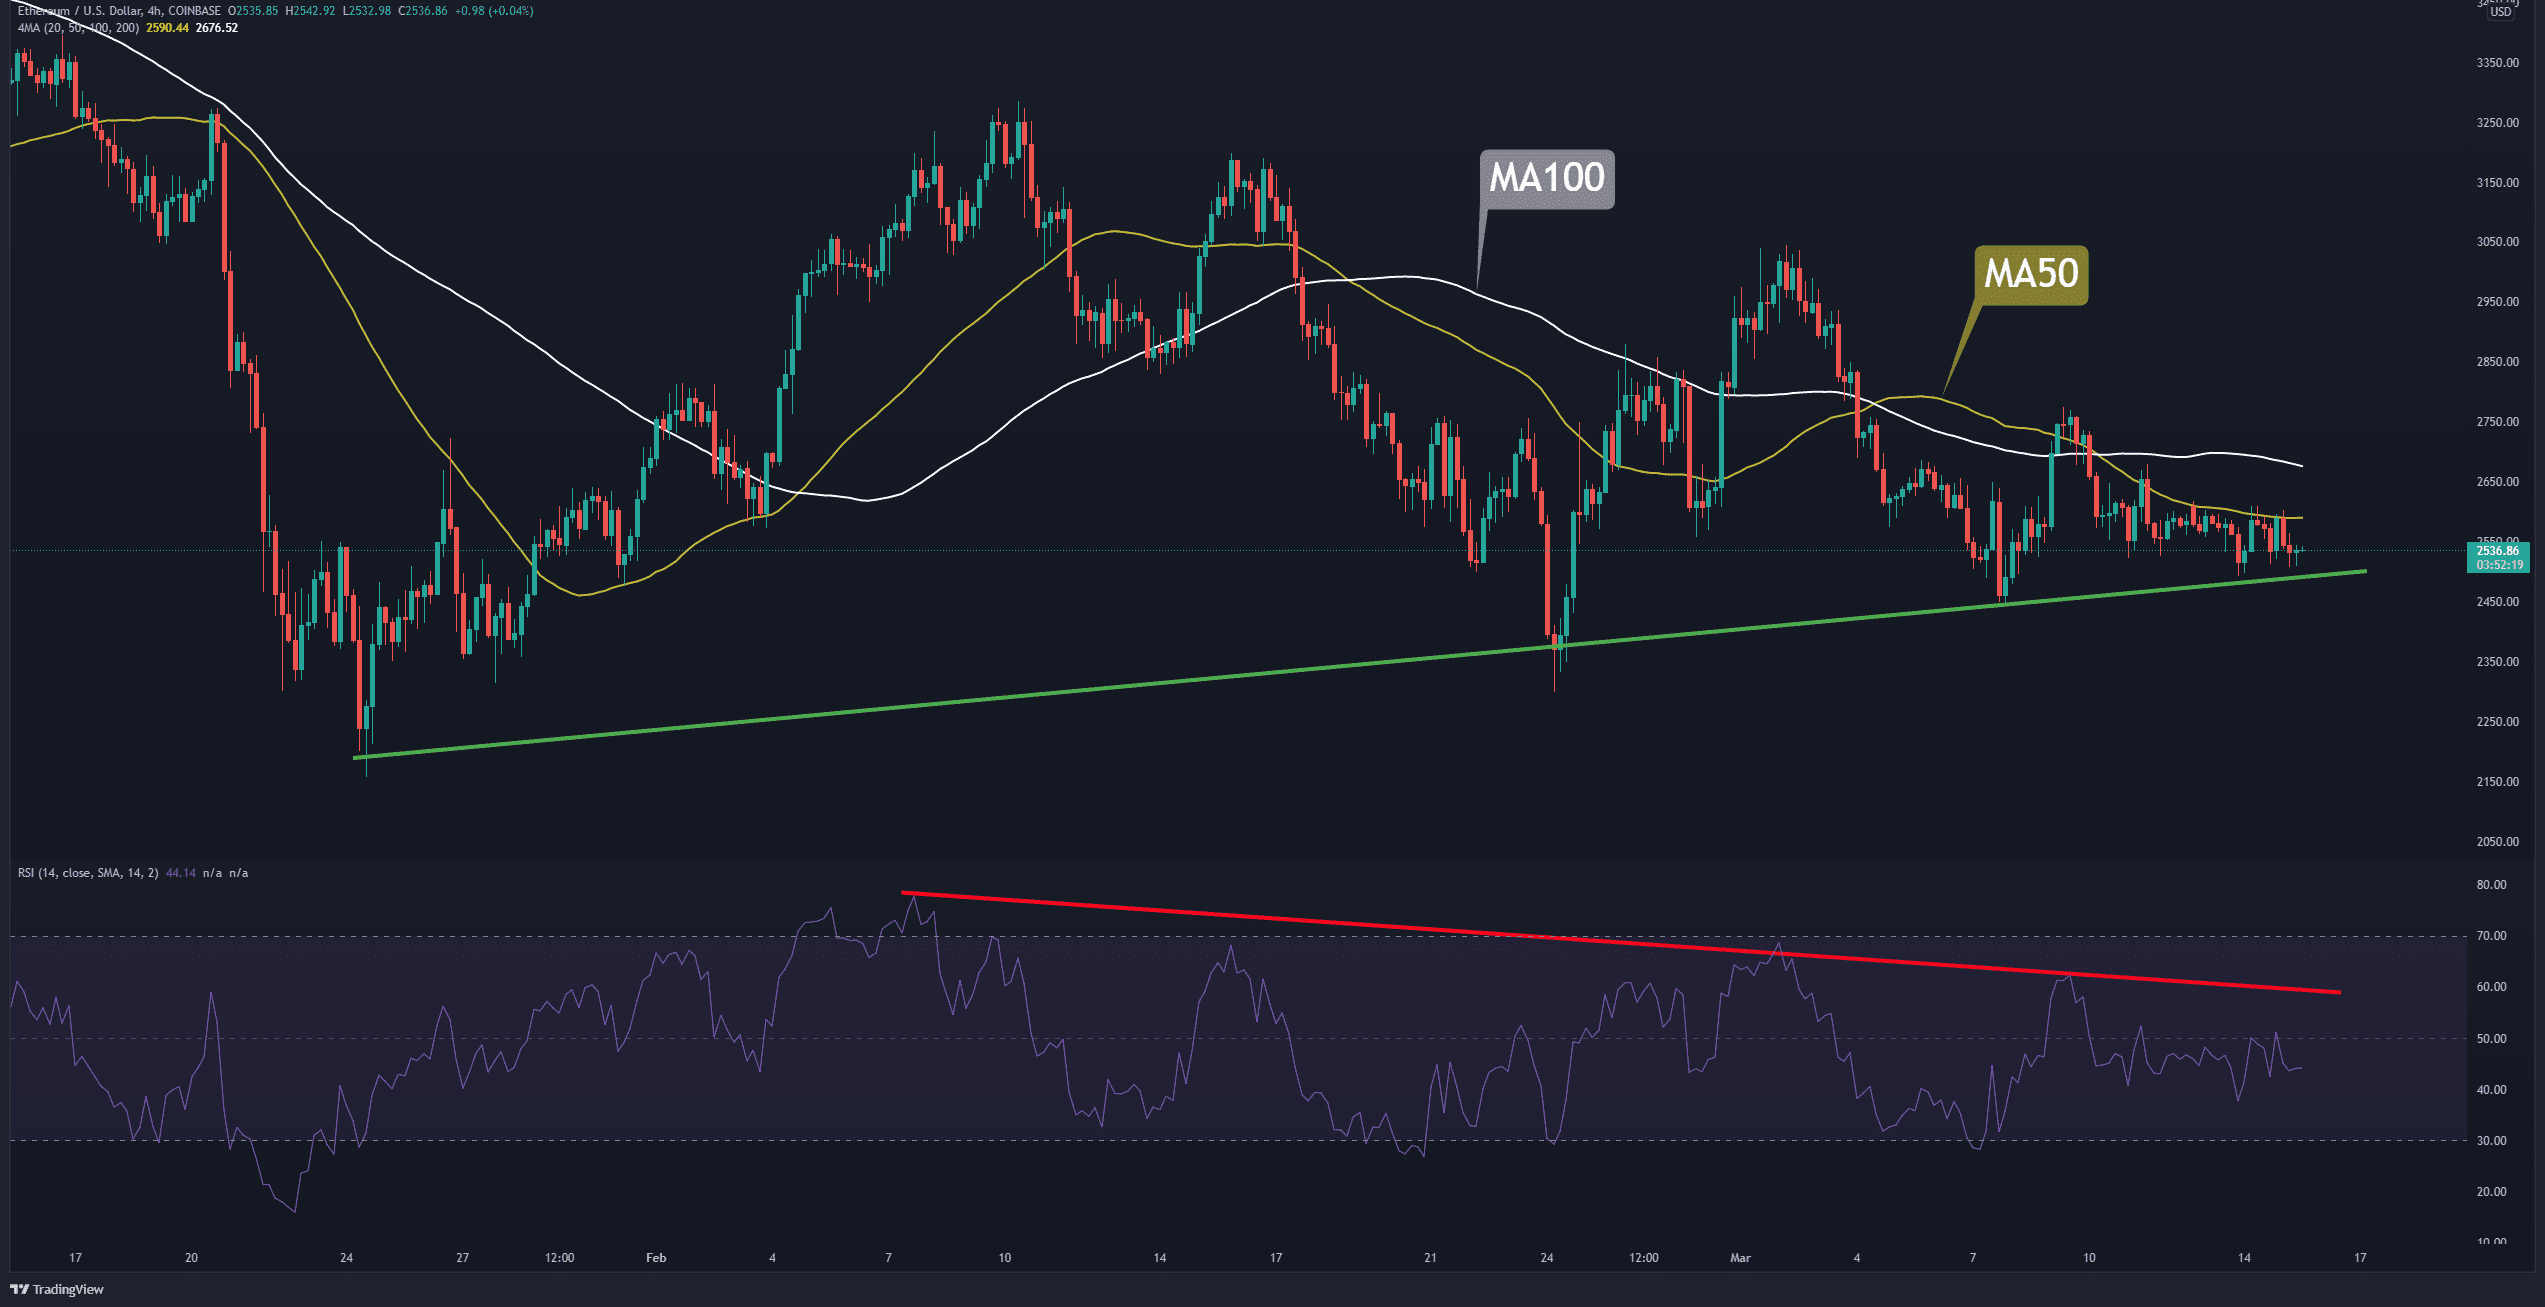
On the 4-hour timeframe, the price is trading on top of its short-term support (marked by green) and below the MA-50 and MA-100 lines (marked by yellow and white).
The two levels have prevented the price from rising over the past week. As mentioned on the daily analysis, the bulls need to look at $2650, which is the area between the MA-50 and MA-100 lines. The RSI-14 is below the downtrend line and also its baseline, this indicates that the bears control the market. However, in the case of a bullish breakout above $2650, it seems that the RSI will also break up.
Conclusion
The charts don’t tell us much during days like this: A sideways and ‘boring’ trend that does not move much. All eyes are on the Federal Reserve meeting, which will decide the interest rate and the Russia – Ukraine situation.


