Ripple Price Analysis: XRP On the Verge of Breaking Below a Critical Support
The bulls have so far managed to keep XRP above crucial support. The cryptocurrency experienced a 15% correction following a rejection at the 50-day moving average.
Technical Analysis
By Grizzly
The Daily Chart
The mid-term chart structure for XRP has become relatively unpredictable. Multiple supports have failed to hold the price, which are now acting as resistance levels.
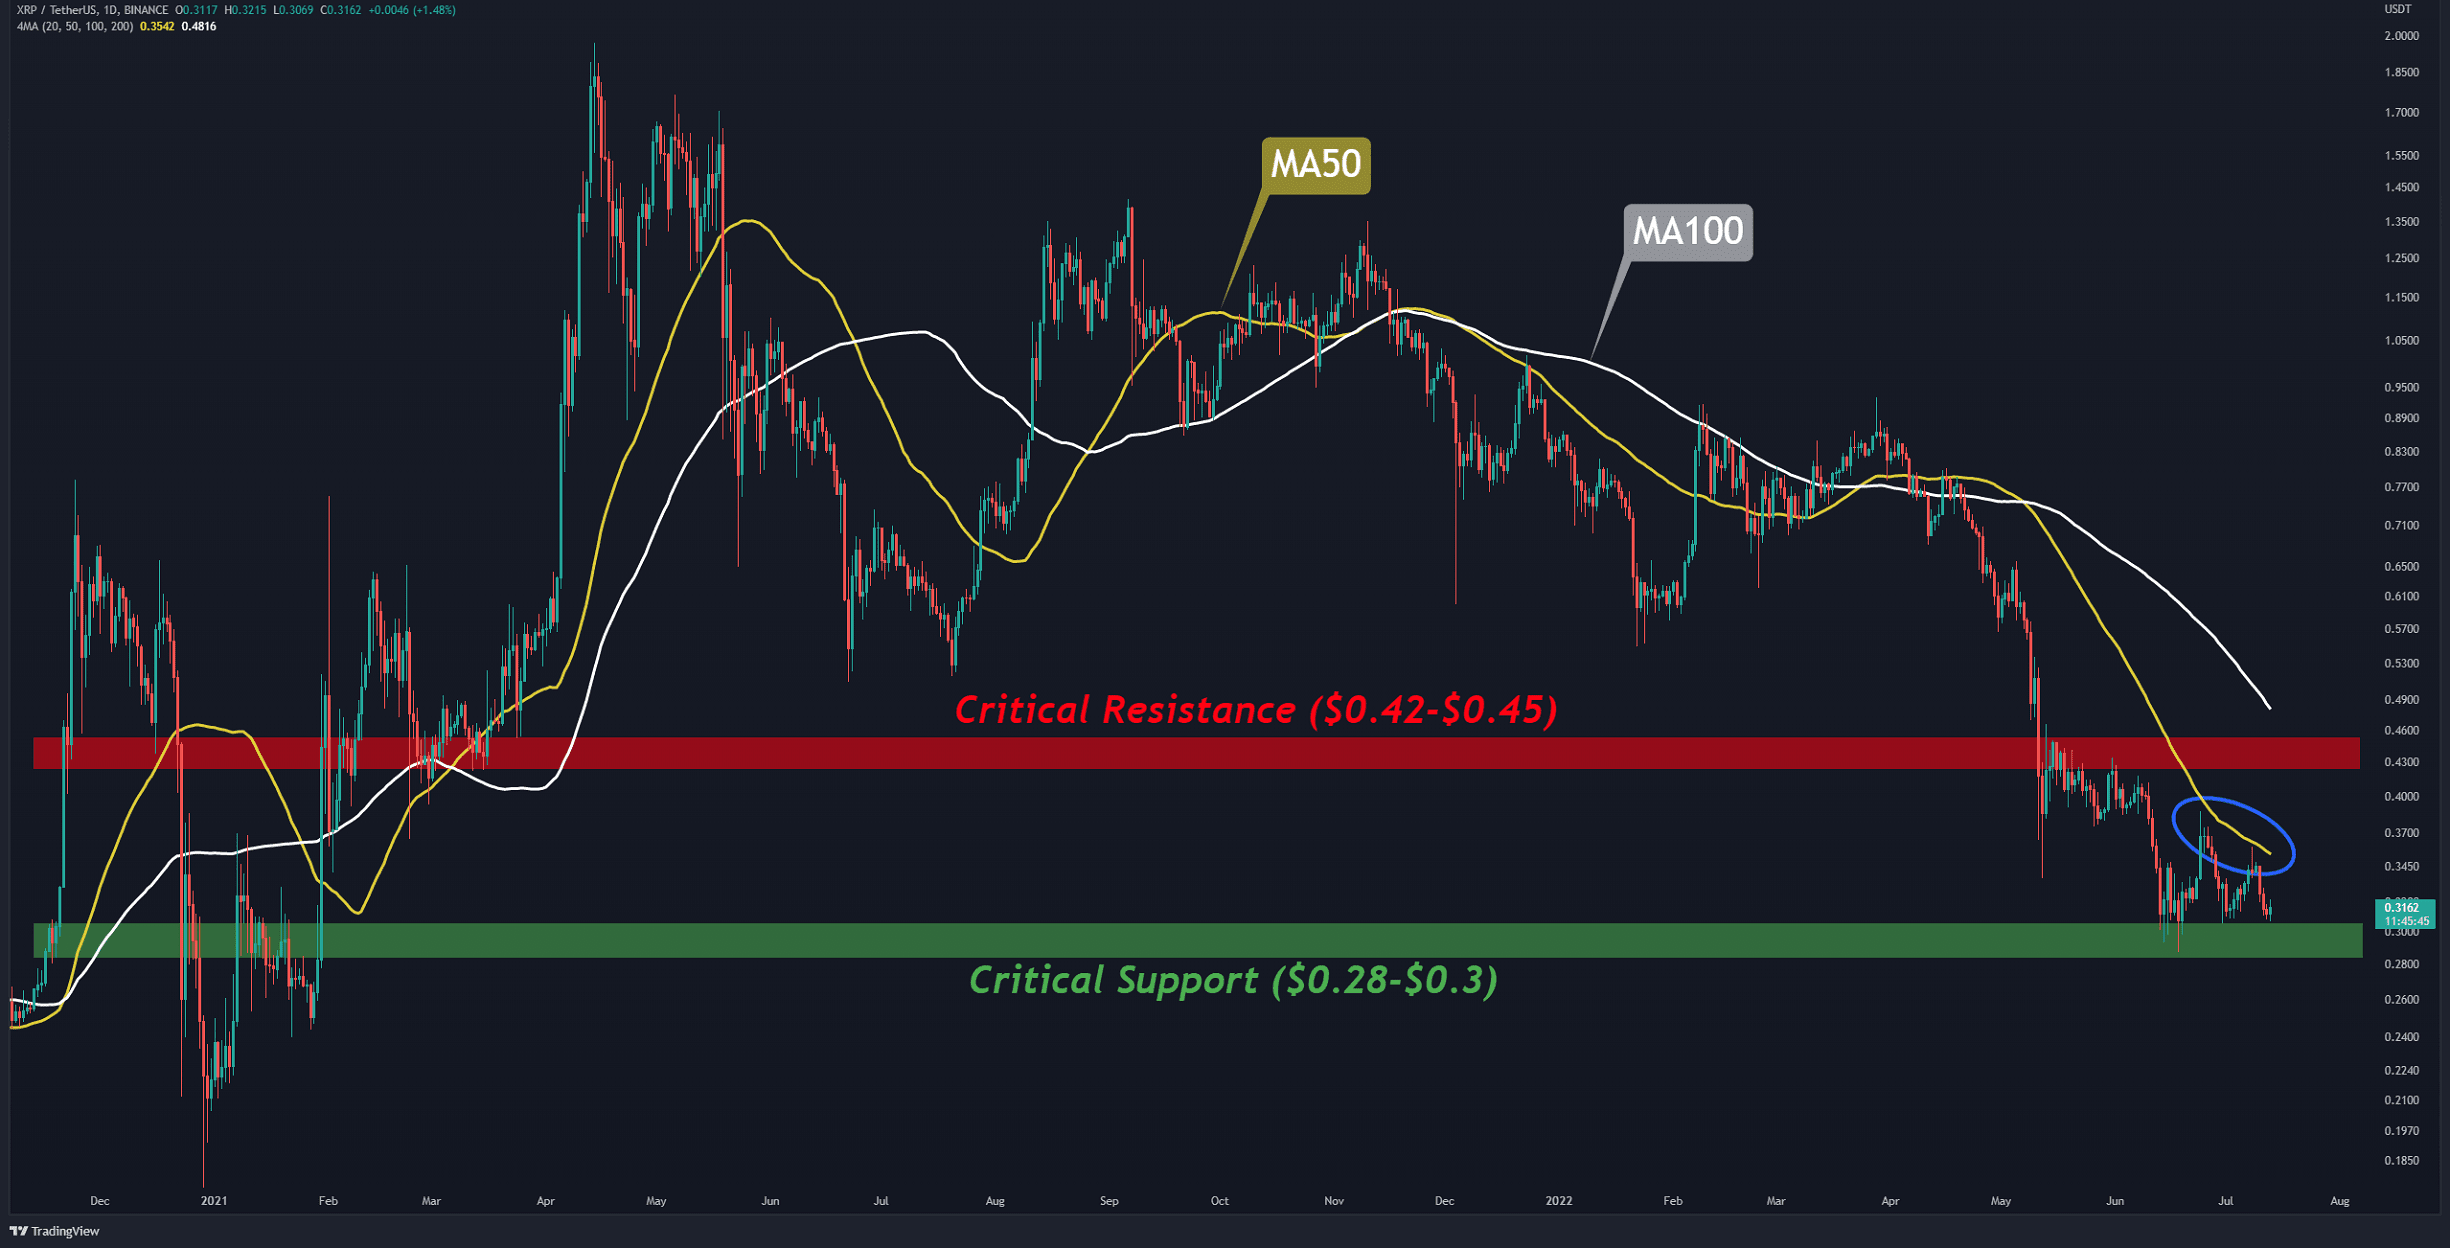
Two critical levels are evident on the price chart: resistance at $0.42-$0.45 (in red) and support at $0.28-$0.3 (in green). The next major market move depends on breaking one of these levels. However, the mission for bulls seems to be more difficult. Even if they can push the price above the 50-day moving average line (in yellow) and $0.4, they still face a strong barrier resulting from the combination of the 100-day moving average (in white) and the red resistance zone.
Key Support Levels: $0.28 & $0.24
Key Resistance Levels: $0.40 & $0.45

Moving Averages:
MA20: $0.33
MA50: $0.36
MA100: $0.48
MA200: $0.62
The XRP/BTC Chart
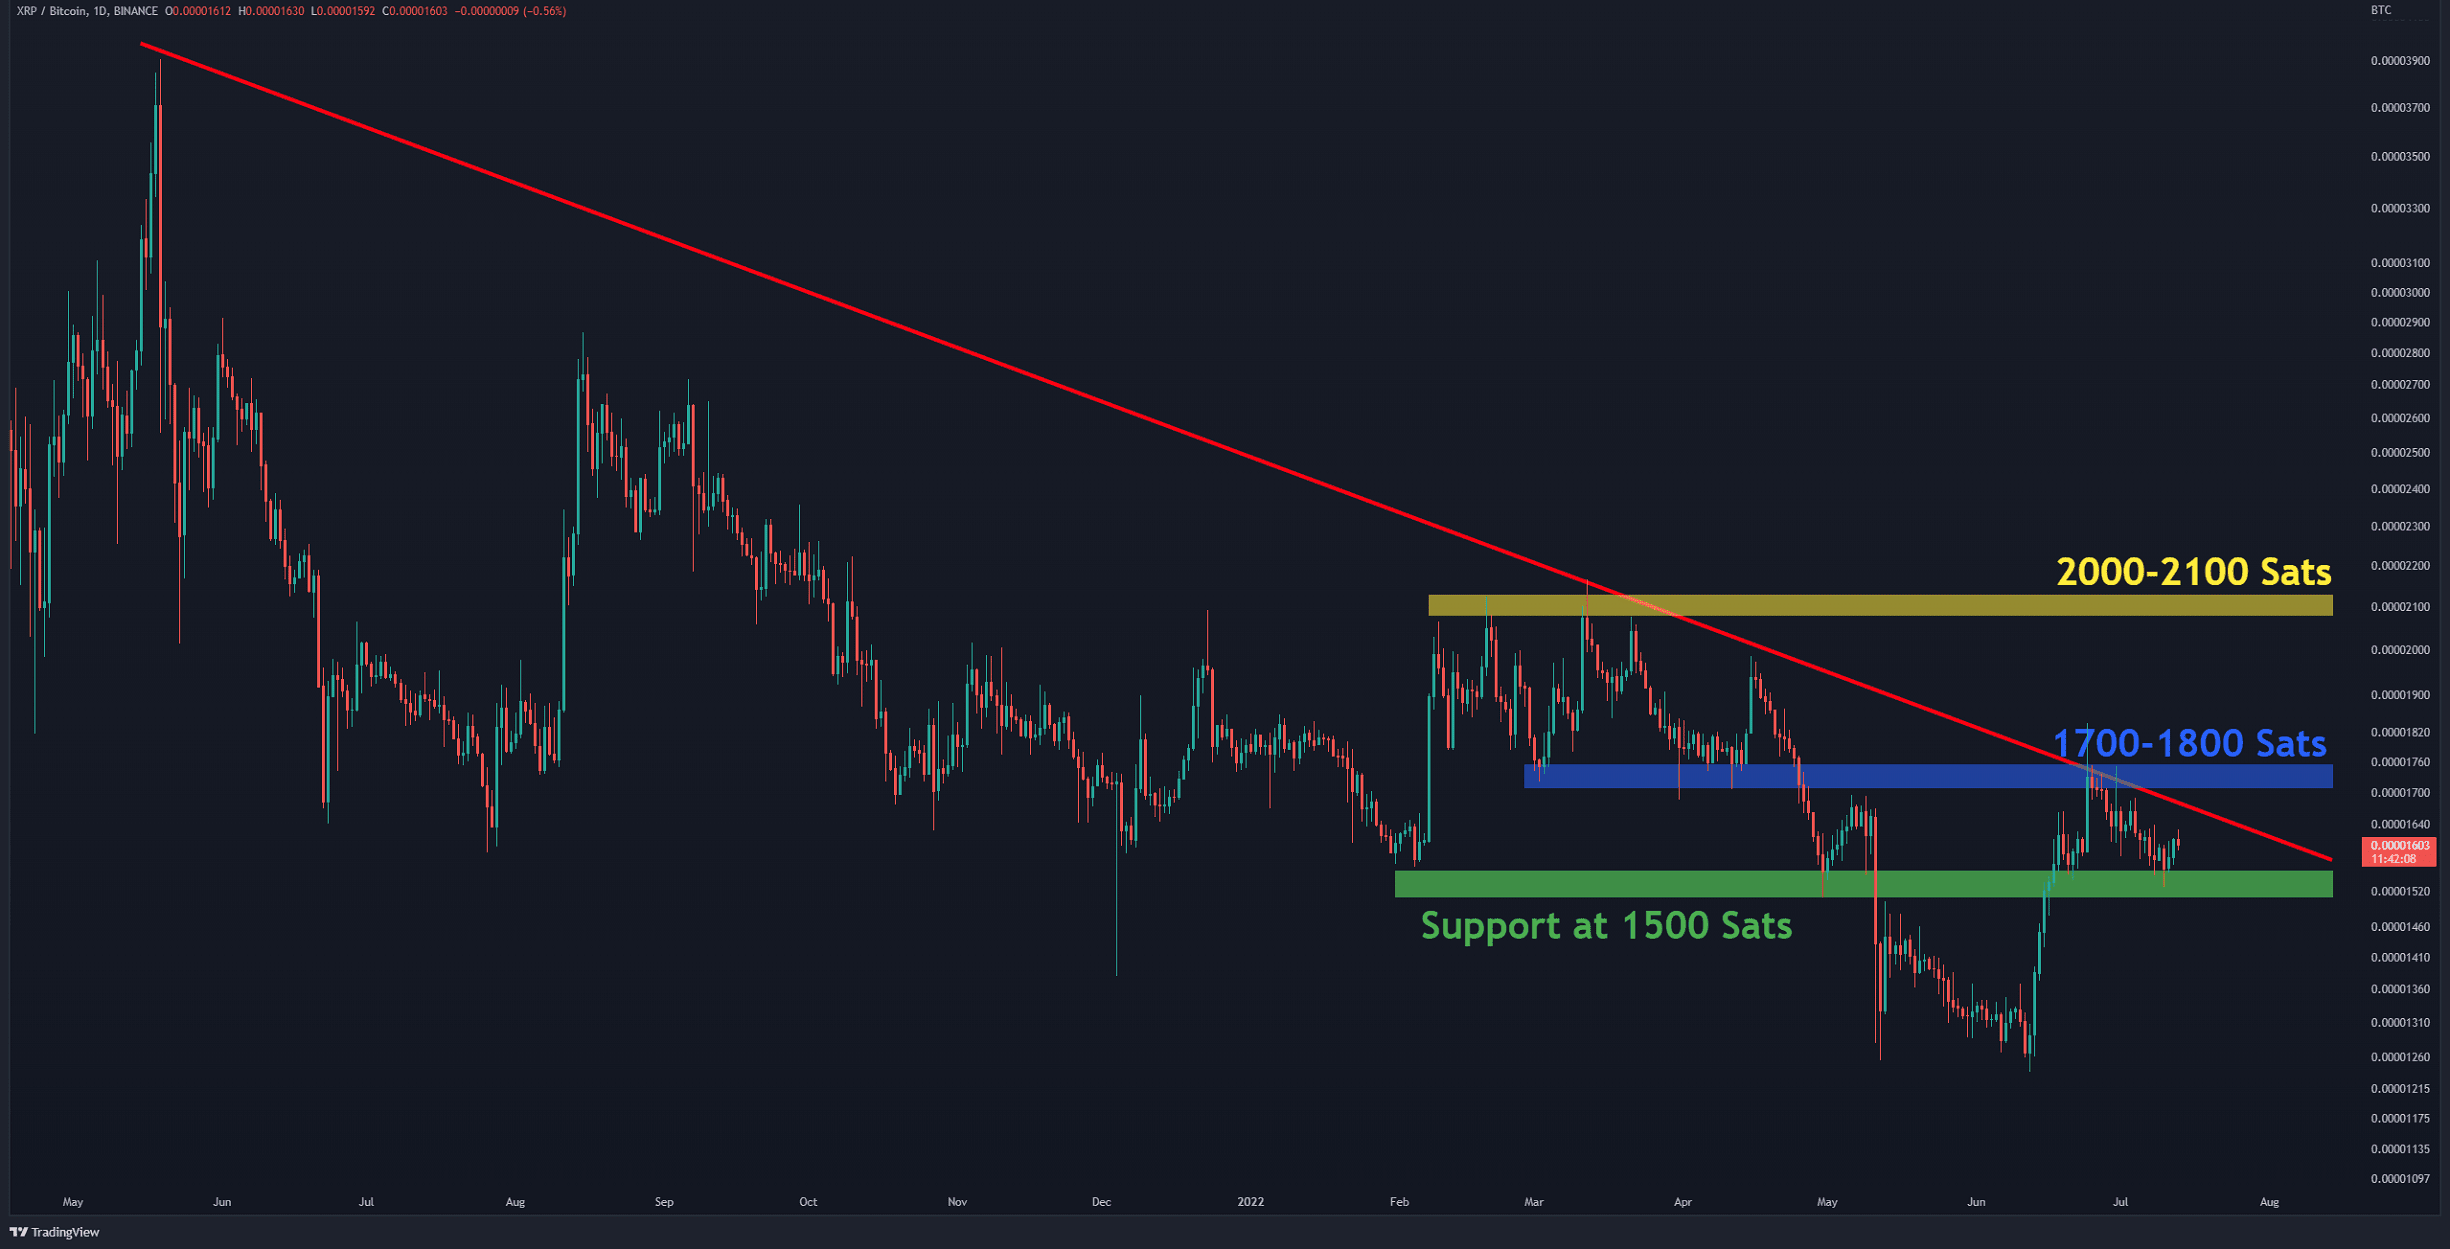
Against Bitcoin, XRP’s trading structure is relatively positive. Buyers have been able to defend the support at 1500 SATs so far. The key necessity for a rally is for the bulls to push the price above the horizontal resistance at 1700-1800 SATs (in blue). In this case, XRP will gain outstanding momentum because this breakout could convince speculators that the trend has reversed by forming a higher high. On the other hand, the bullish scenario in this chart becomes invalid if it breaks below 1500 SATs.
Key Support Levels: 1500 SATs & 1250 SATs
Key Resistance Levels: 1800 SATs & 2000 SATs

On-chain Analysis

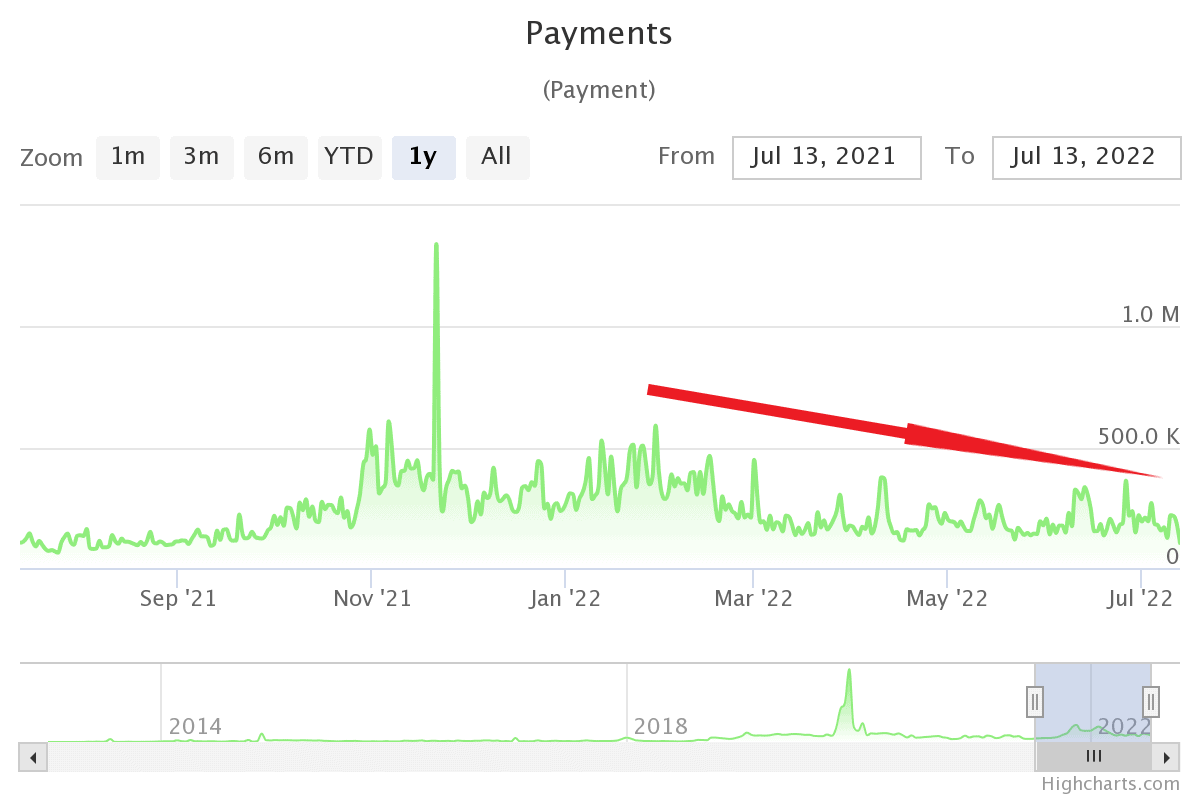
By examining the XRP network, it can be seen that the number of payment transactions has decreased since the beginning of the year. It has reached 103,000 from a high of 590,000. This is a confirmation of demand leaving the network.
