ETH Facing Key Support at $1K – Reversal or More Blood Incoming? (Ethereum Price Analysis)
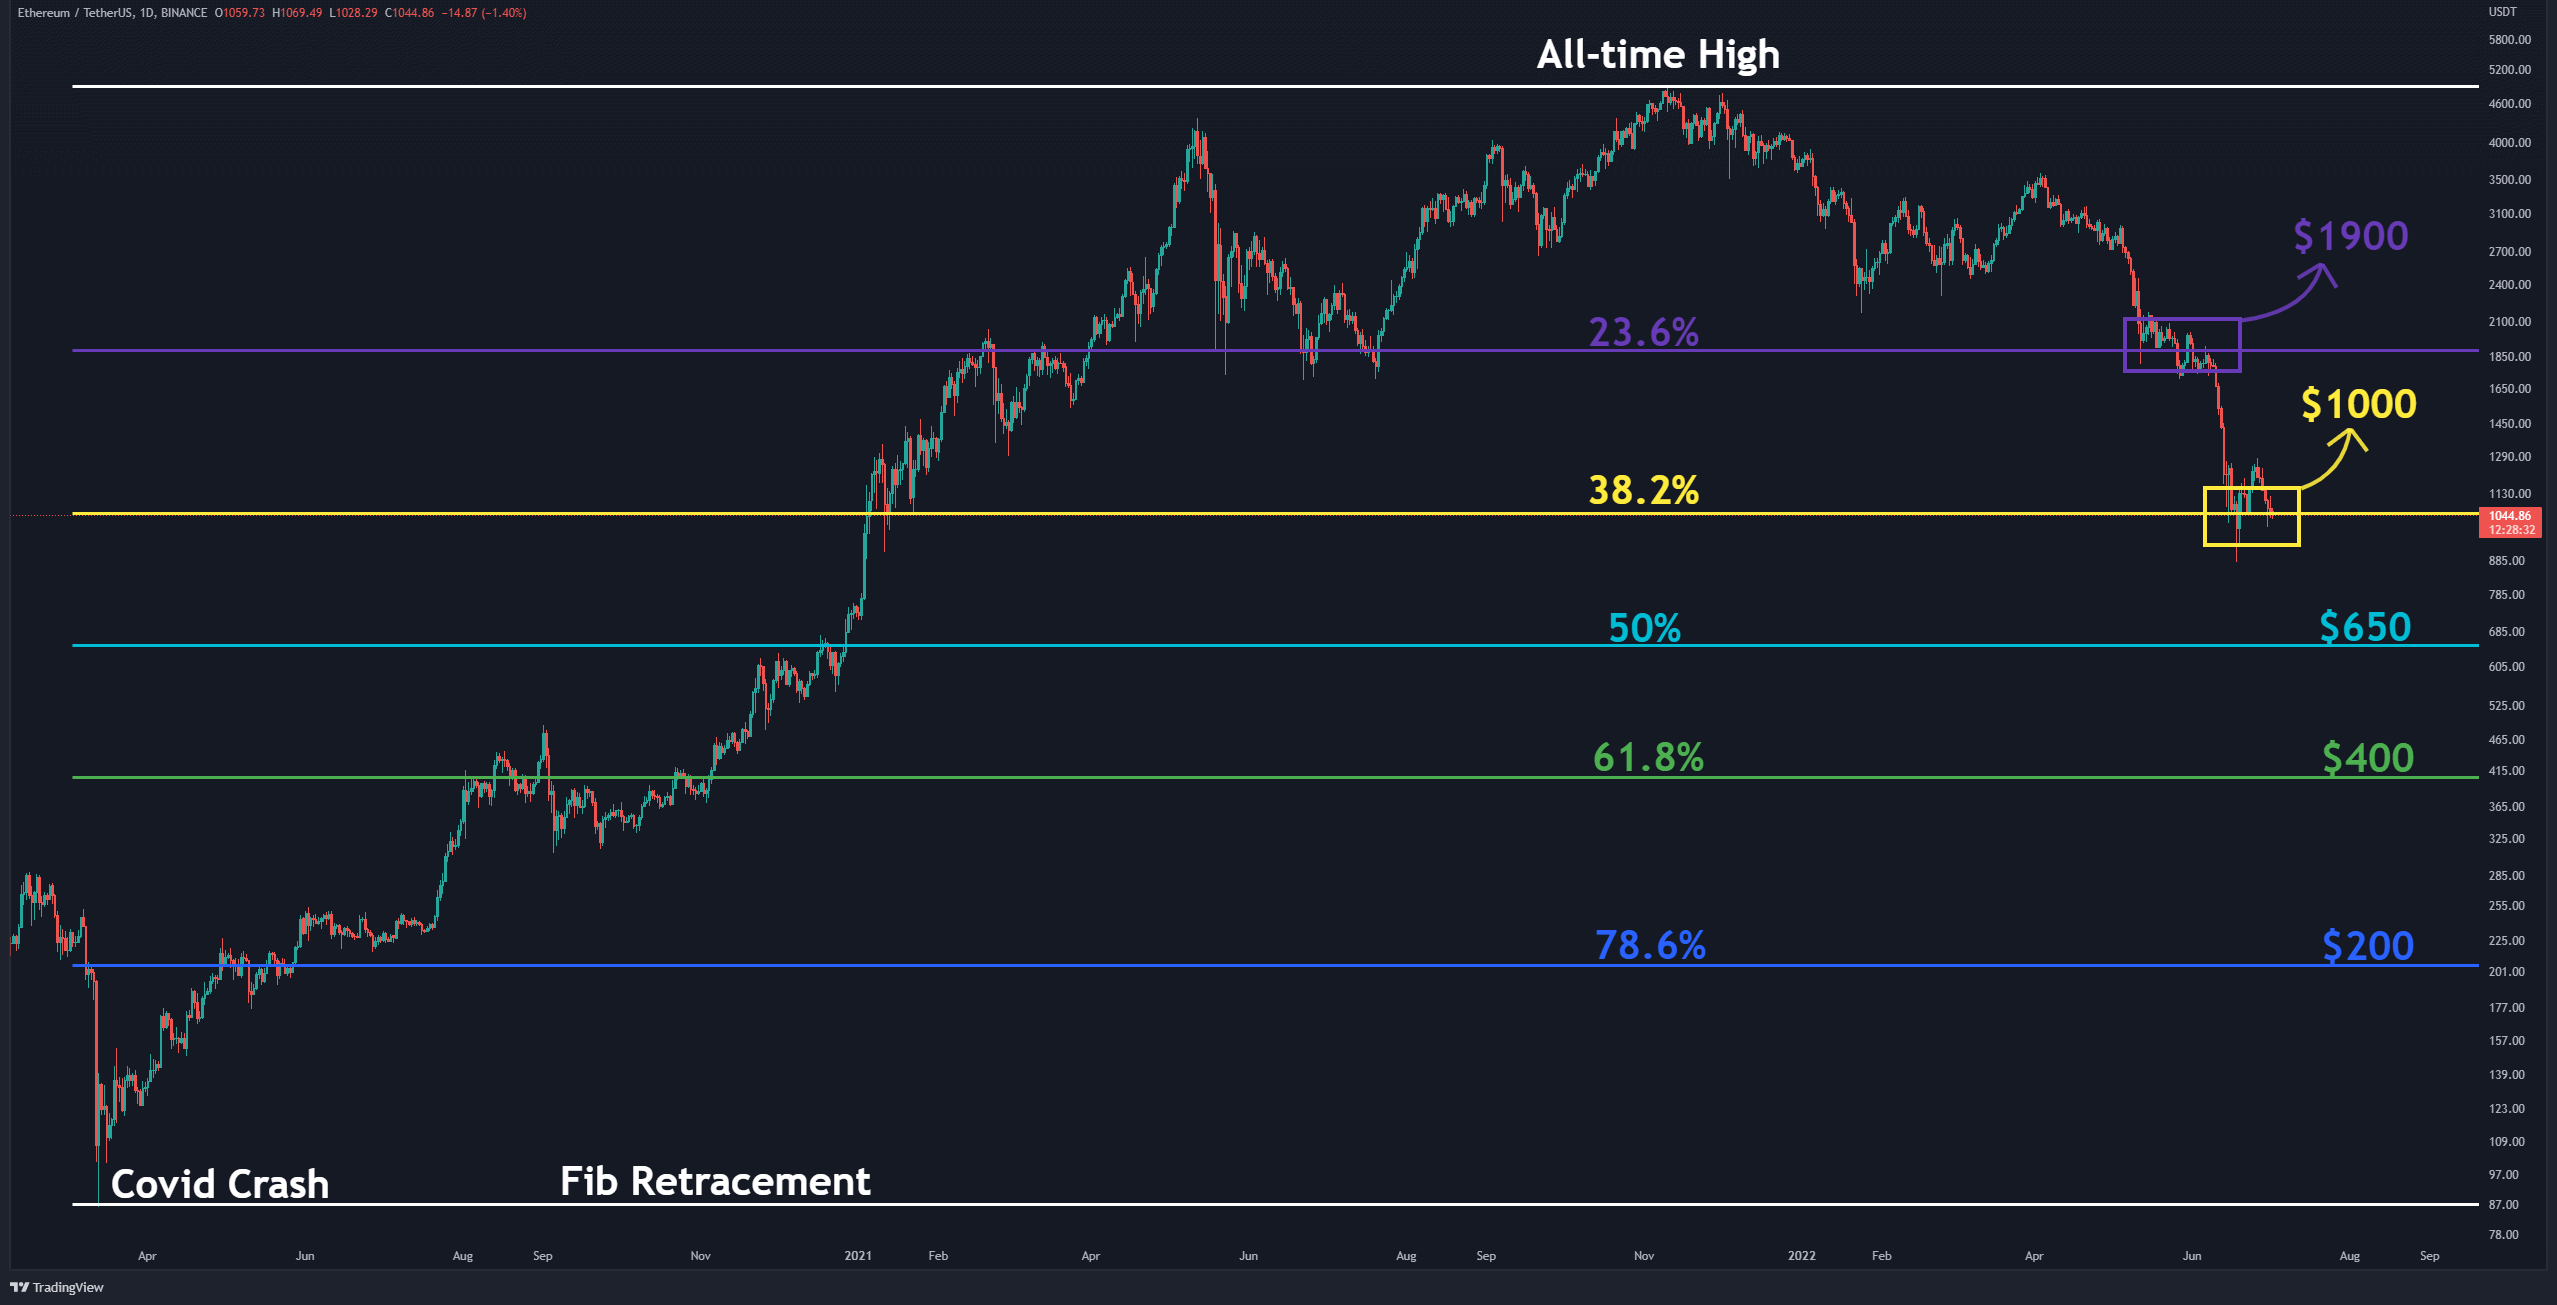
On a macro scale, the bears have corrected 38.2% of the 600-day mega bullish trend since the COVID crash of March 2020 to reaching the current ETH’s all-time high: a spike from below $100 to over $4600. As of writing these lines, bulls are fighting to maintain the critical level of $1,000.
Technical Analysis
Technical Analysis By Grizzly
The Daily Chart
Using the Fibonacci retracement levels, ETH has touched two significant levels during this ongoing correction: 23.6% at $1,900 and 38.2% at $1,000.
Undoubtedly, these support and resistance levels are closely observed by the majority of technical analysts. Suppose buyers fail to defend the psychological support at $1,000, reaching lower levels is not out of the question – the next Fib level lies at the 50% correction and a price of $650. Further below, the next support is at 61.8% (the golden level), which lies at $400.
Moving Averages:
MA20: $1132
MA50: $1575
MA100: $2271
MA200: $2675
The ETH/BTC Chart
On the BTC pair chart – the weekly timeframe, the uptrend that started in September 2019 encountered a barrier at 0.088 BTC.
The structure turned bearish since the price formed a lower low following a lower high. As shown below, ETH has corrected more than 23.6% of the macro-scale trend. This level – 0.06 BTC – is currently acting as horizontal resistance. The following support levels are also marked on the chart:
On-chain Analysis
Transaction Count (Total) – SMA 30
Definition: The total number of transactions in which a transfer of tokens has been executed.
Uptrends are often associated with an increasing number of transactions. Since recording the all-time high in November 2021, the number of transactions on the Ethereum network has decreased sharply and reached its lowest level over the past year.
It’s expected that once reversal signals pop, the on-chain activity increases.


