Bitcoin has typically experienced two phases in each cycle; a bull market in which the price surges and records a new all-time high, followed by a bear market when the price experiences a significant decline.
Technical Analysis
By Shayan
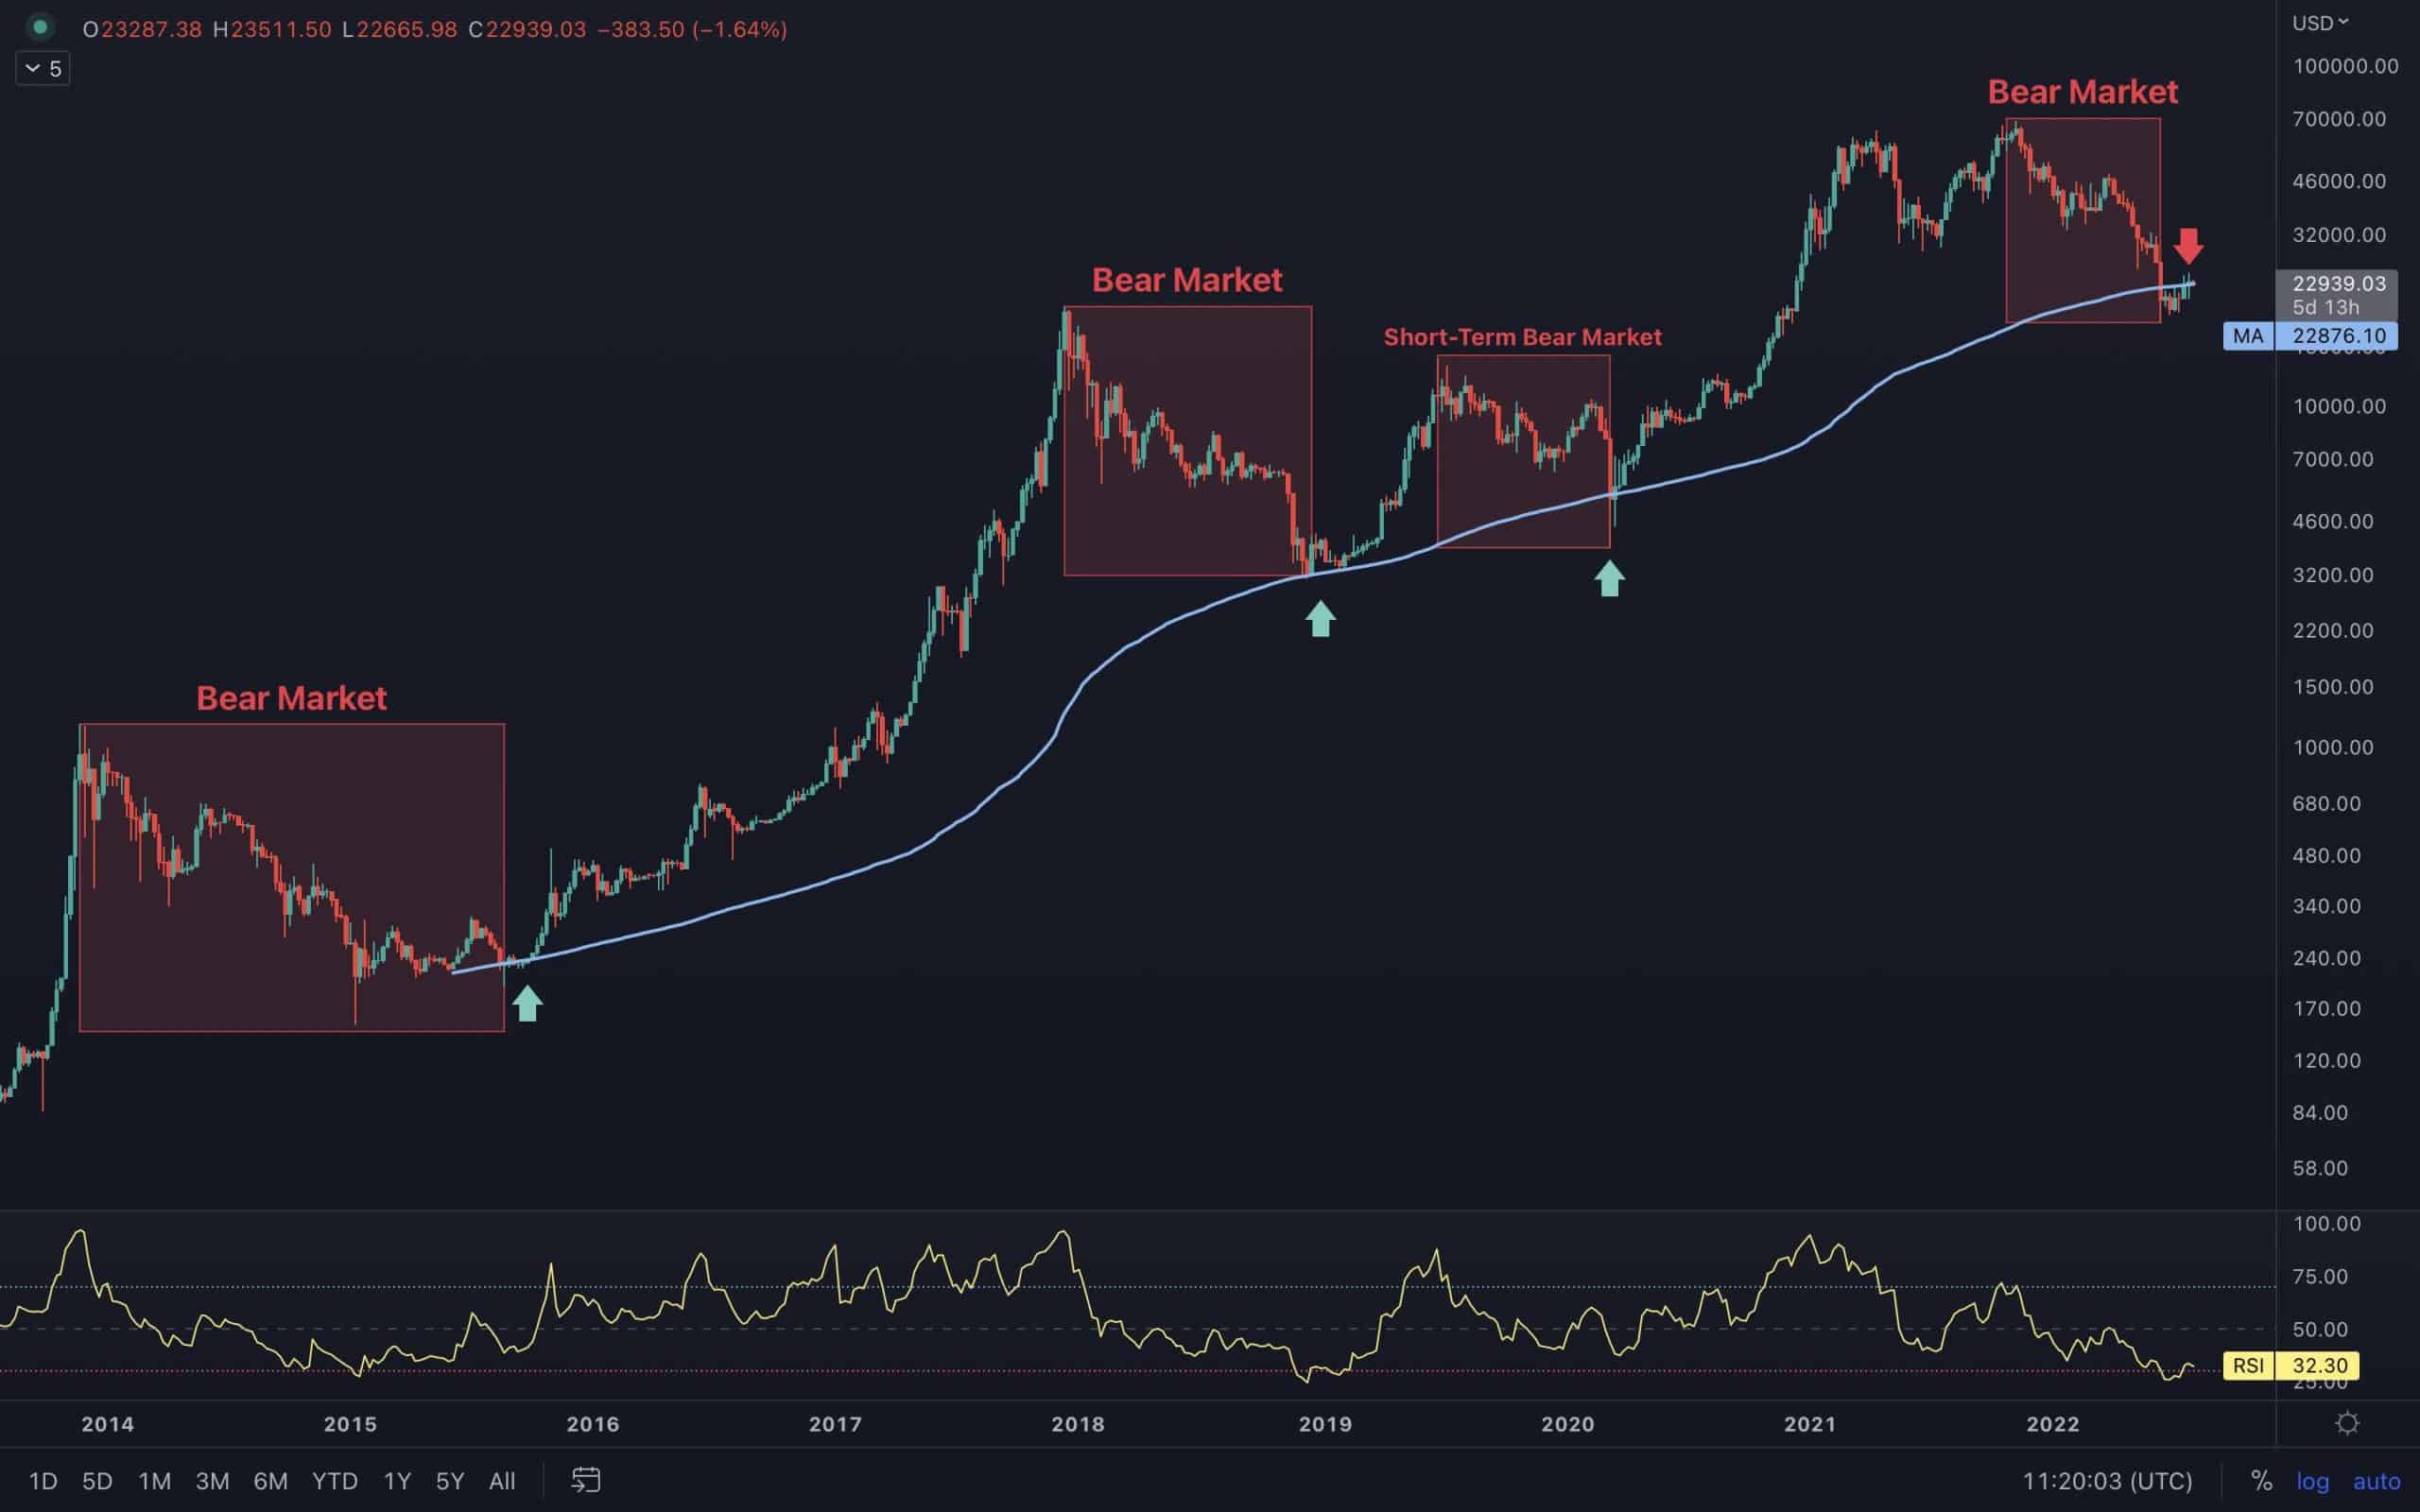
The Weekly Chart
Historically, at the end of each bear market, after experiencing a +80% correction while Bitcoin tries to find a long-term bottom and commence its next bullish rally, the price has briefly touched the 200-week moving average.
Remarkably, during the recent significant shakeout, the price fell below this consequential moving average and retraced to the broken level at about $24K. If the pullback pattern holds up, it might be taken as validation for another leg down to the $16K level. On the contrary, if the cryptocurrency succeeds in breaching the moving average, a rebound toward the $27K resistance level will be highly anticipated.
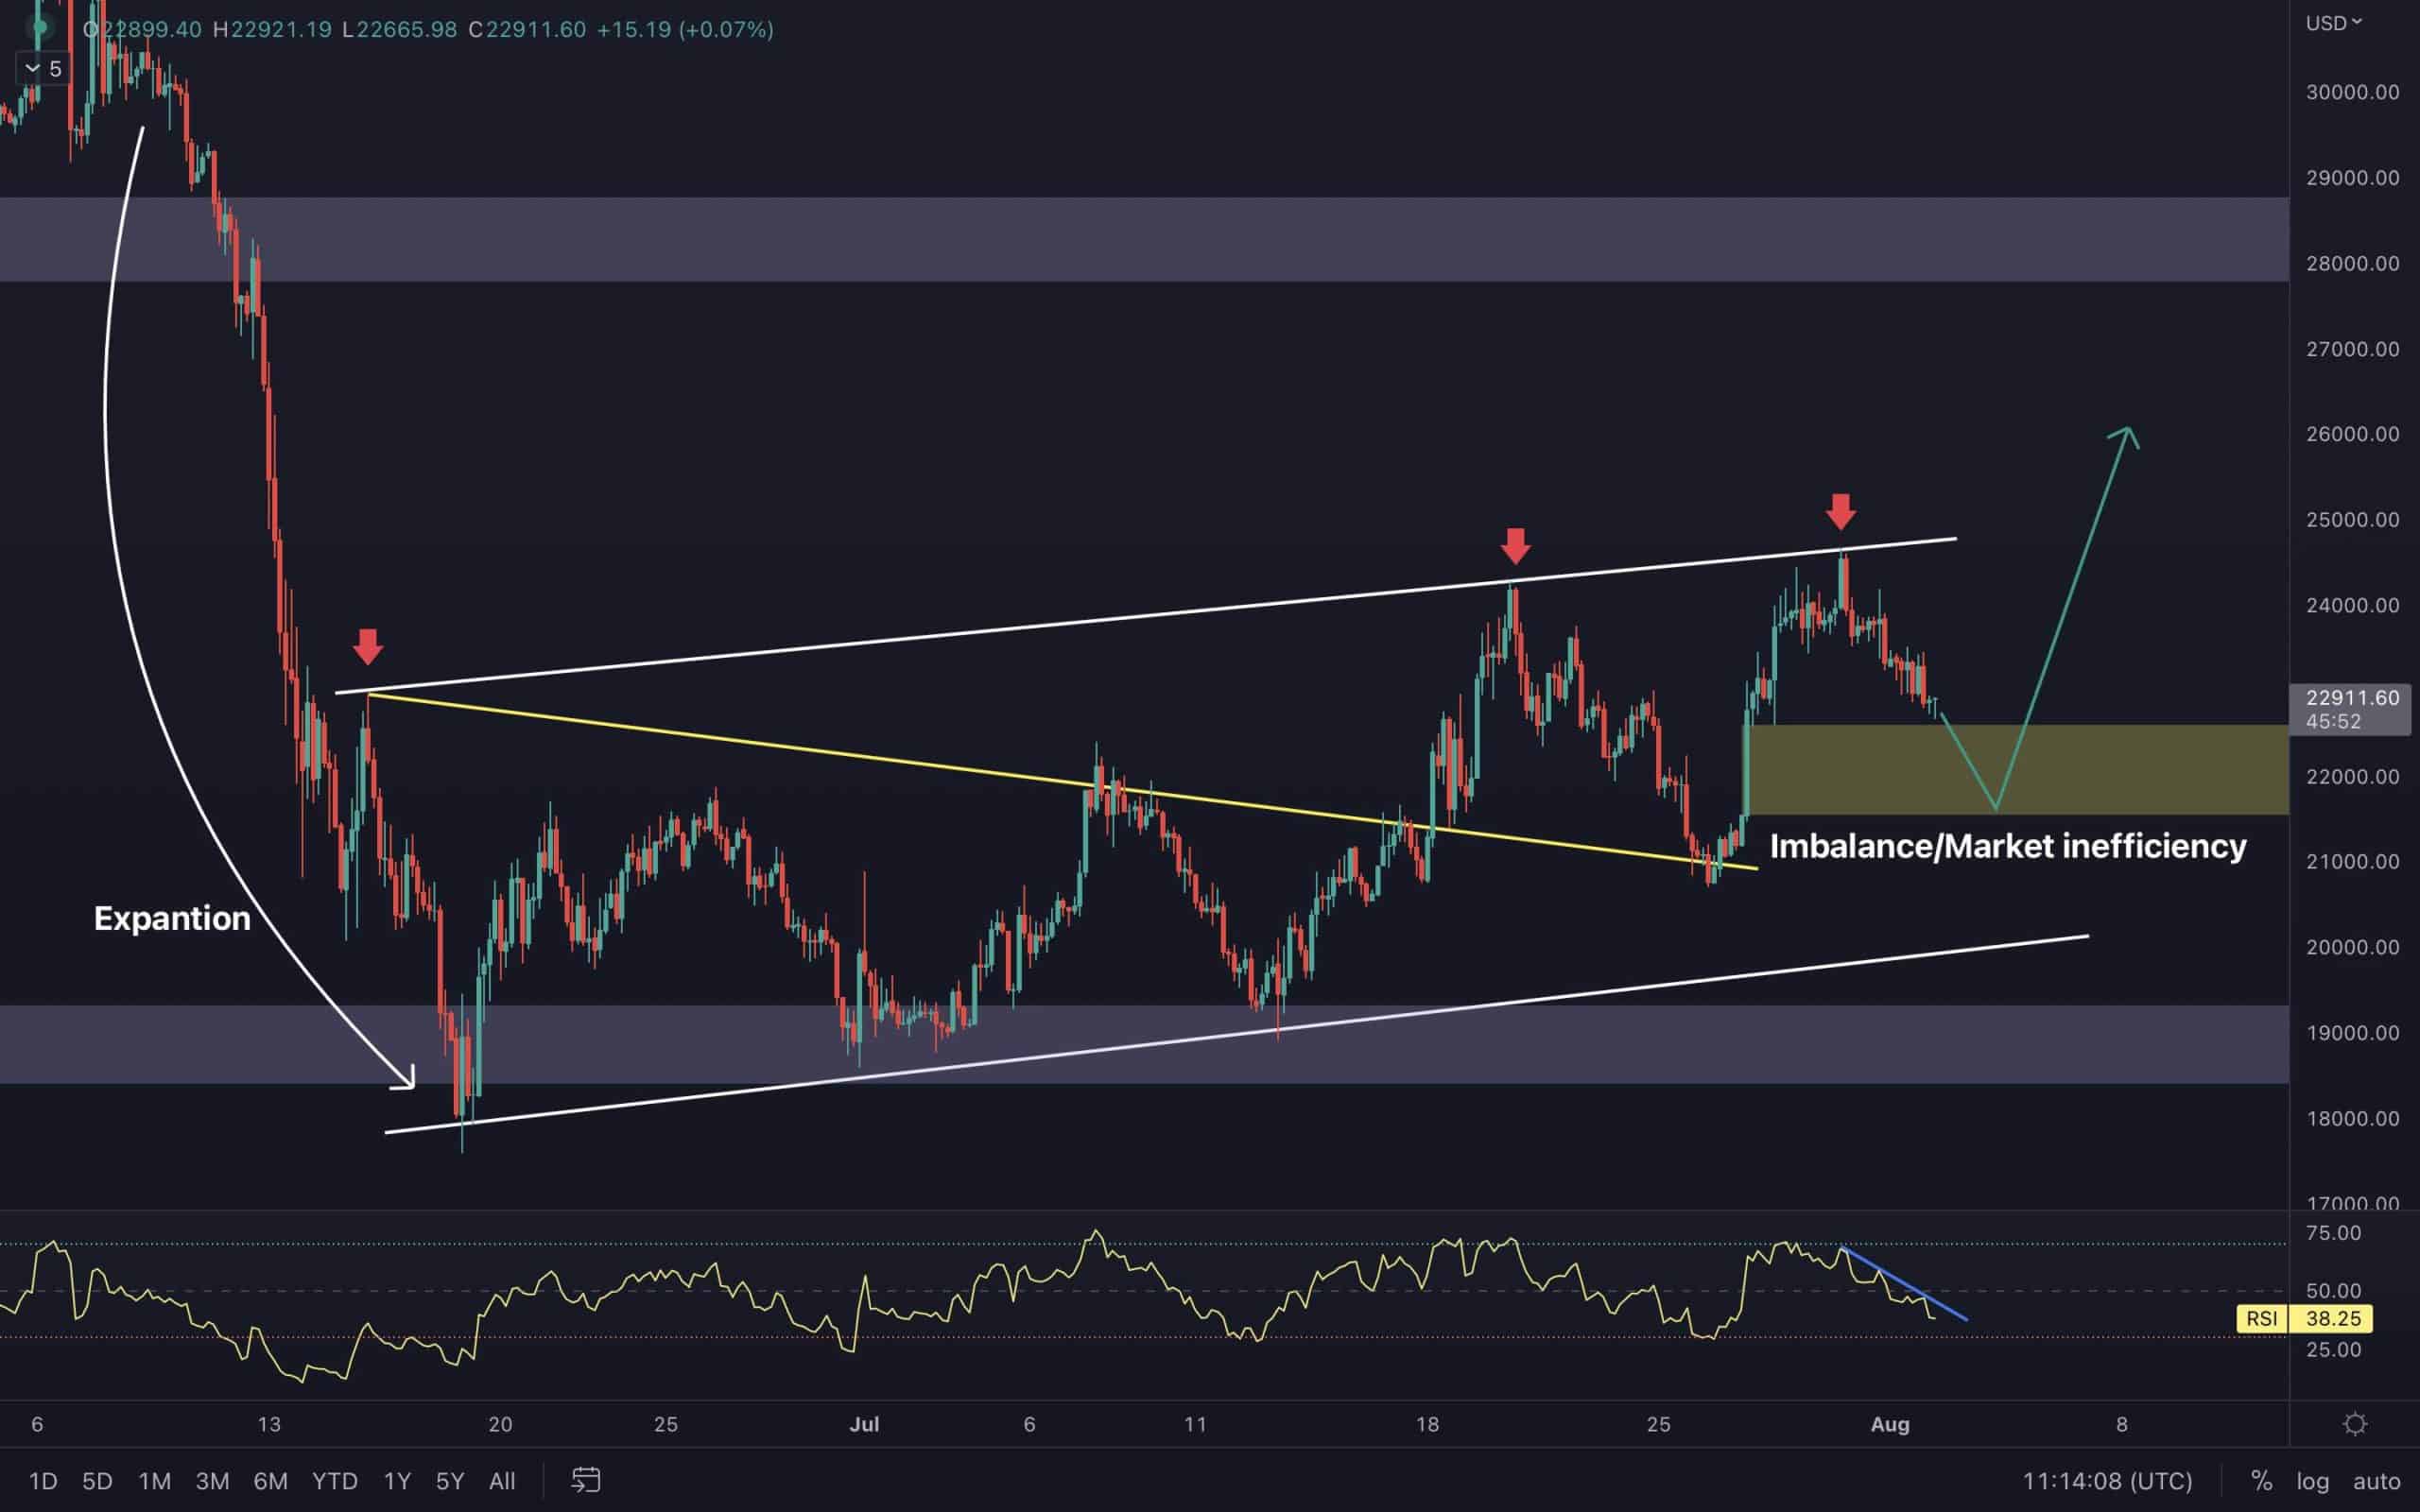
The 4-Hour Chart
After experiencing a bearish expansion rally, the price has formed a well-known classic pattern called a flag. After testing the lower edge alongside the $19K support level, the price has finally initiated a short-term rally and attempted to break the upper boundary. However, BTC failed to overtake the flag’s upper threshold and is slightly plummeting.
Nevertheless, a clear double-top price action pattern(a notable reversal pattern) can be determined in Bitcoin’s 4-hour timeframe chart. Considering that, BTC seems likely to experience another shakeout to retest the $19K. If the $19K critical support level fails to hold the price, the next destination will be the $16K mark. On the other hand, there is a high prospect for the price to use the existent imbalance/market inefficiency at around $22K to begin its next major rally toward the $27K significant resistance.
On-chain Analysis
By: Edris
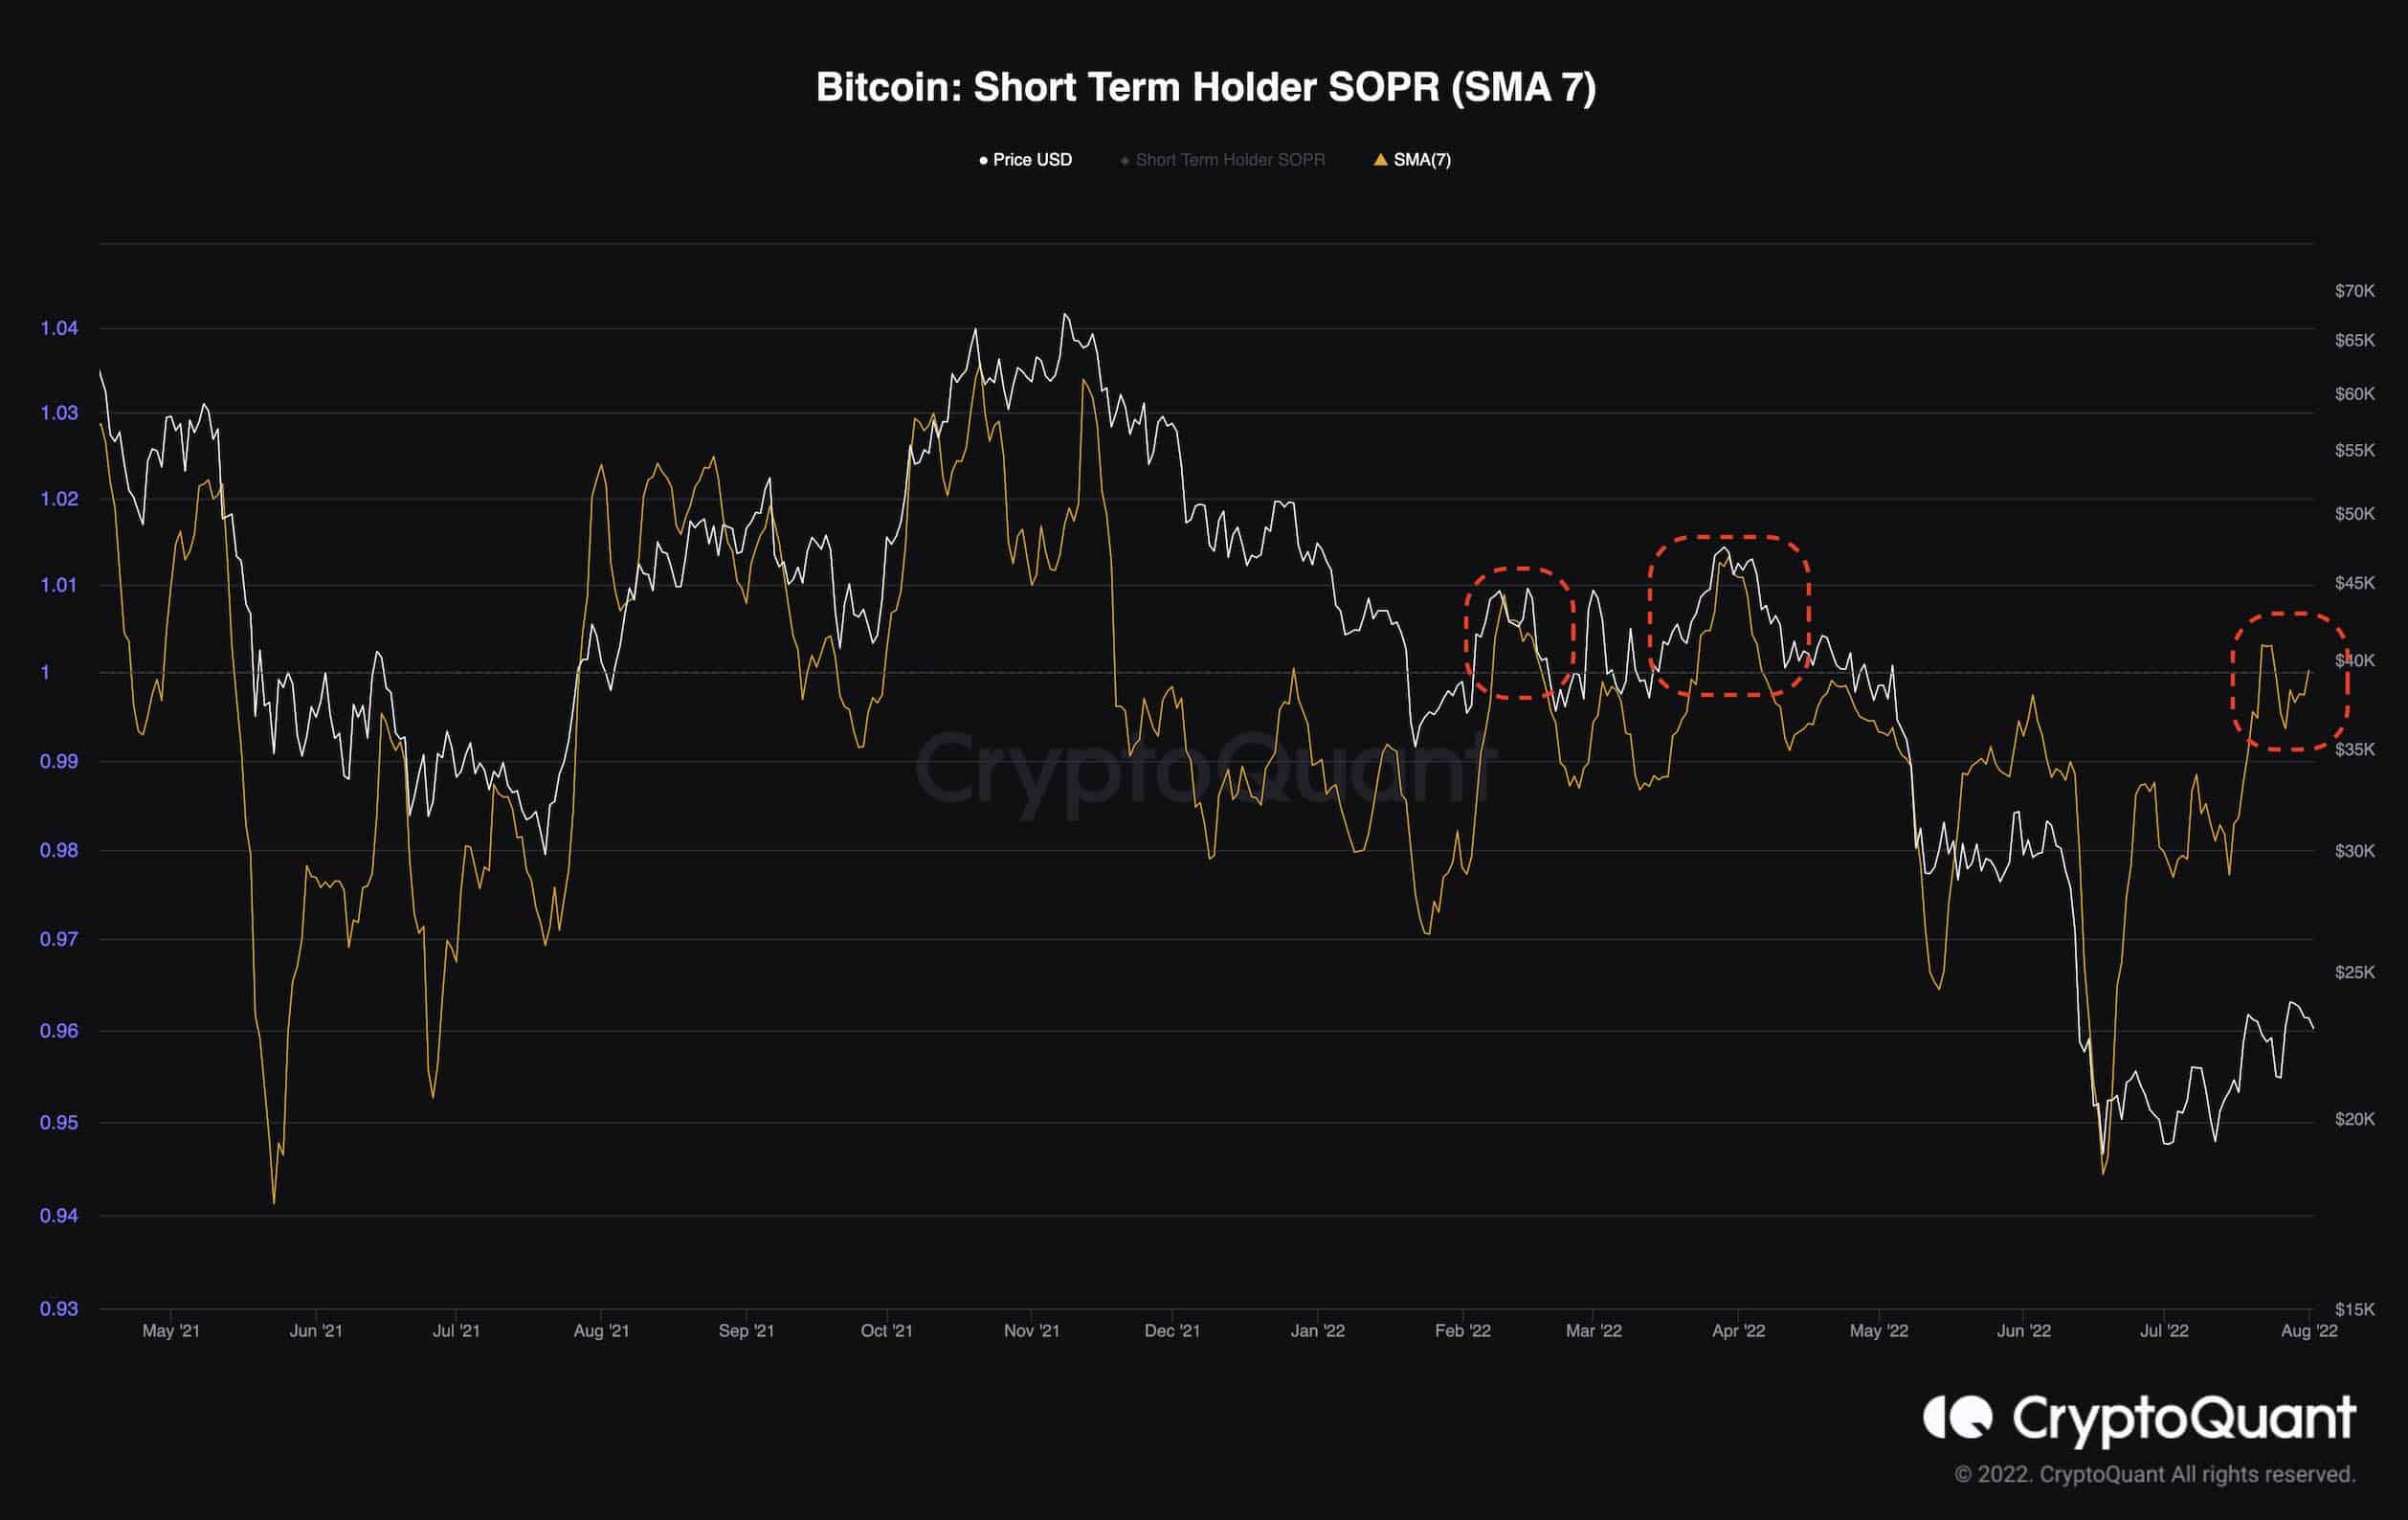
Bitcoin Short Term Holder SOPR
Bitcoin has been bouncing from the $20K support area over the last few weeks after massive loss realizations by many different groups of market participants.
The recent uptrend has led to some profit-taking by the short-term holders, who bought Bitcoin over the last couple of months at $20K or lower. This behavior is demonstrated on the short-term holders’ SOPR chart with SOPR values above 1 for the first time since March 2022.
Previous profit-taking periods during the current bearish trend have mostly been by smart money who took advantage of the exit liquidity available after a short rally. Their selling pressure has contributed to the beginning of a new bearish move. So, their current behavior may be no different, and if the magnitude of these profit takings rises in the next few weeks, they could act as a catalyst to another bearish continuation in the short term.